
- Start >
- Rivers >
- Discharge >
- Untere Donau >
- Kothmaißling >
- Chart of year

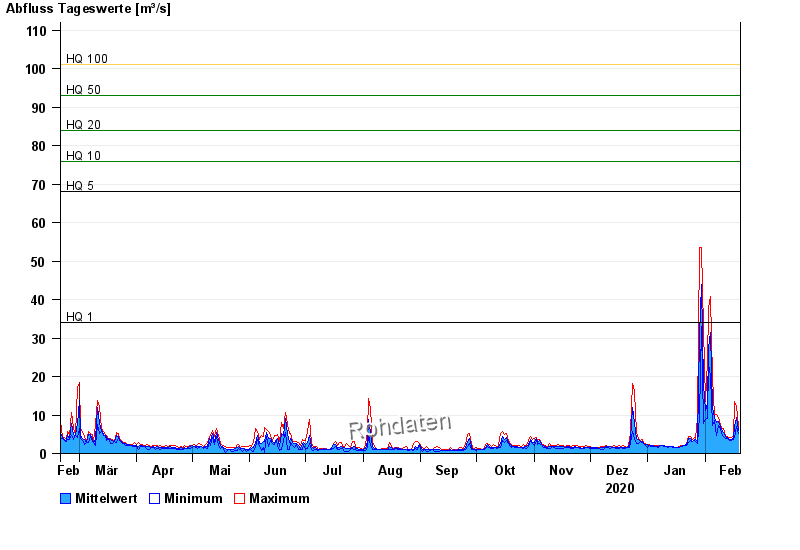
Chart of year Kothmaißling / Chamb
Discharge from 20.02.2020 to 19.02.2021
note
Beeinflussung durch Buhneneinbau unterhalb vom Pegel
- HQ1 34 m³/s
- HQ5 68 m³/s
- HQ10 76 m³/s
- HQ20 84 m³/s
- HQ50 93 m³/s
- HQ100 101 m³/s
| Date | Mean value [m³/s] | Maximum [m³/s] | Minimum [m³/s] |
|---|---|---|---|
| 19.02.2021 | 5.24 | 6.16 | 4.25 |
| 18.02.2021 | 8.57 | 11.4 | 6.16 |
| 17.02.2021 | 6.25 | 12.5 | 3.38 |
| 16.02.2021 | 3.08 | 3.73 | 2.88 |
| 15.02.2021 | 2.99 | 3.39 | 2.73 |
| 14.02.2021 | 3 | 3.4 | 2.74 |
| 13.02.2021 | 3.49 | 3.76 | 3.07 |
© Bayerisches Landesamt für Umwelt 2024