
- Start >
- Rivers >
- Discharge >
- Untere Donau >
- Kothmaißling >
- Chart of year

Chart of year Kothmaißling / Chamb
Discharge from 23.11.2020 to 22.11.2021
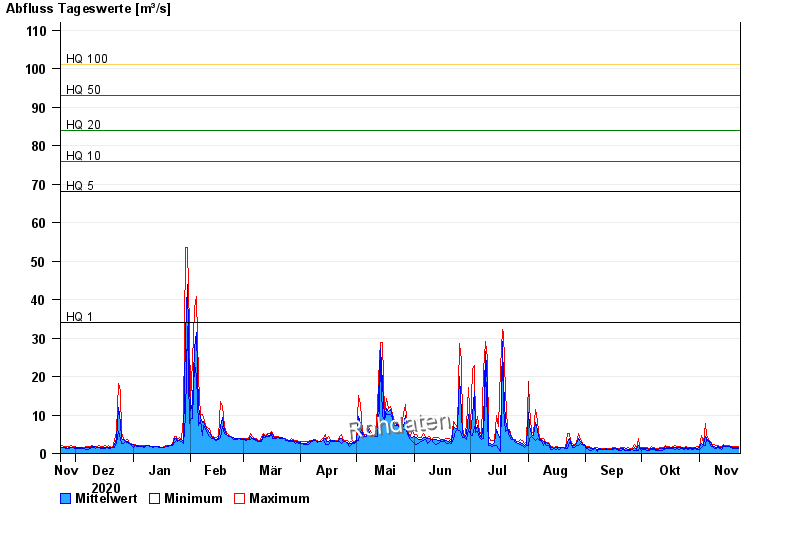
- HQ1 34 m³/s
- HQ5 68 m³/s
- HQ10 76 m³/s
- HQ20 84 m³/s
- HQ50 93 m³/s
- HQ100 101 m³/s
| Date | Mean value [m³/s] | Maximum [m³/s] | Minimum [m³/s] |
|---|---|---|---|
| 22.11.2021 | 1.58 | 1.75 | 1.45 |
| 21.11.2021 | 1.49 | 1.68 | 1.31 |
| 20.11.2021 | 1.56 | 1.75 | 1.38 |
| 19.11.2021 | 1.51 | 1.67 | 1.31 |
| 18.11.2021 | 1.67 | 1.75 | 1.59 |
| 17.11.2021 | 1.74 | 1.82 | 1.67 |
| 16.11.2021 | 1.74 | 1.82 | 1.66 |
© Bayerisches Landesamt für Umwelt 2025