
- Start >
- Rivers >
- Discharge >
- Untere Donau >
- Kothmaißling >
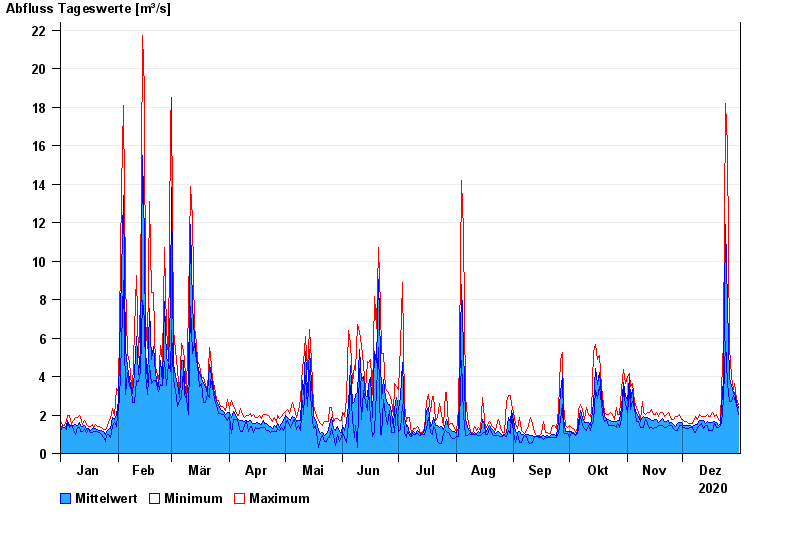
- Chart of year

Chart of year Kothmaißling / Chamb
Discharge from 01.01.2020 to 31.12.2020
| Date | Mean value [m³/s] | Maximum [m³/s] | Minimum [m³/s] |
|---|---|---|---|
| 31.12.2020 | 2.25 | 2.35 | 2 |
| 30.12.2020 | 2.42 | 2.54 | 2.35 |
| 29.12.2020 | 2.74 | 3.04 | 2.53 |
| 28.12.2020 | 2.71 | 2.83 | 2.63 |
| 27.12.2020 | 2.98 | 3.25 | 2.44 |
| 26.12.2020 | 3.18 | 4.18 | 2.44 |
| 25.12.2020 | 5.76 | 11.9 | 3.03 |
© Bayerisches Landesamt für Umwelt 2025