
- Start >
- Rivers >
- Discharge >
- Untere Donau >
- Parsberg >
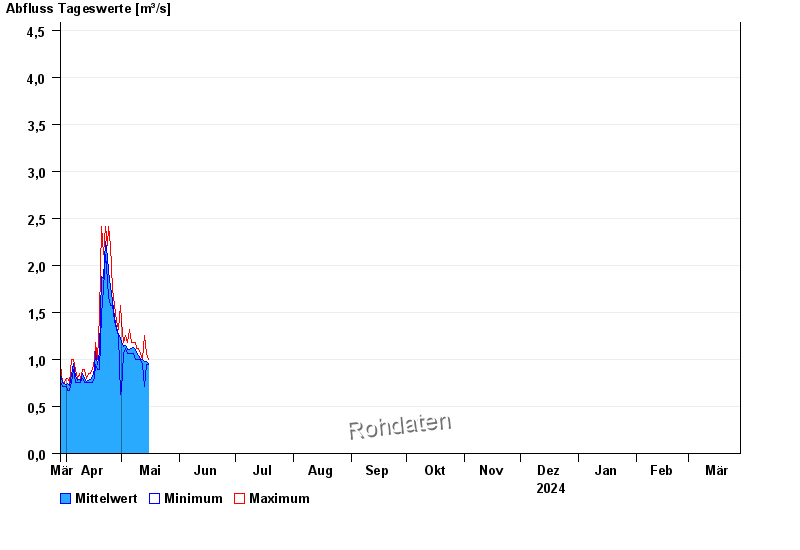
- Chart of year

Chart of year Parsberg / Schwarze Laber
Discharge from 29.03.2024 to 28.03.2025
- HQ1 9 m³/s
- HQ2 12 m³/s
- HQ5 15,5 m³/s
- HQ10 19 m³/s
- HQ20 25 m³/s
- HQ50 36 m³/s
- HQ100 50 m³/s
| Date | Mean value [m³/s] | Maximum [m³/s] | Minimum [m³/s] |
|---|---|---|---|
| 11.07.2024 | 2.75 | 3.84 | 2.1 |
| 10.07.2024 | 2.17 | 2.75 | 1.35 |
| 09.07.2024 | 2.2 | 2.29 | 2.1 |
| 08.07.2024 | 2.36 | 2.56 | 2.1 |
| 07.07.2024 | 2.62 | 2.75 | 2.38 |
| 06.07.2024 | 2.28 | 2.47 | 2.2 |
| 05.07.2024 | 2.4 | 2.66 | 2.29 |
© Bayerisches Landesamt für Umwelt 2024