
- Start >
- Rivers >
- Discharge >
- Untere Donau >
- Passau Ingling >
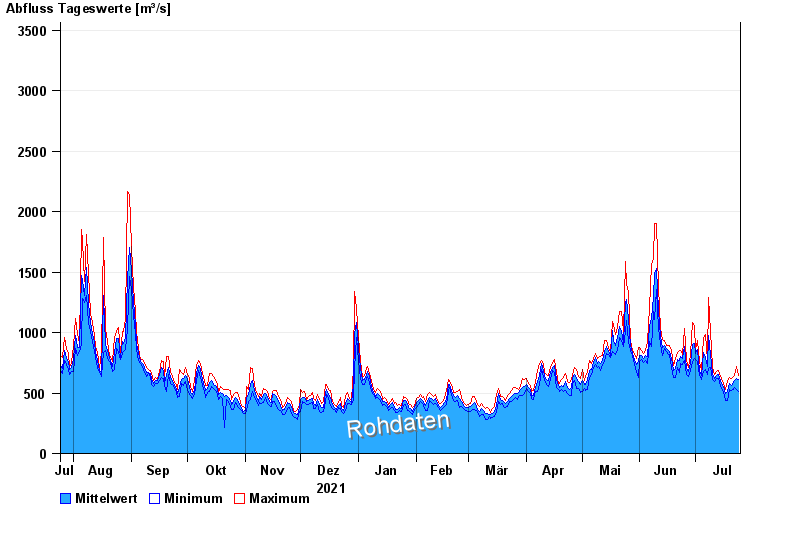
- Chart of year

Chart of year Passau Ingling / Inn
Discharge from 25.07.2021 to 24.07.2022
- 03.06.2013 Abfluss: 6820 m³/s
- 10.07.1954 Abfluss: 6700 m³/s
- 15.09.1899 Abfluss: 6600 m³/s
- 13.08.2002 Abfluss: 5600 m³/s
- 08.09.1920 Abfluss: 5310 m³/s
| Date | Mean value [m³/s] | Maximum [m³/s] | Minimum [m³/s] |
|---|---|---|---|
| 24.07.2022 | 610 | 645 | 512 |
| 23.07.2022 | 624 | 719 | 527 |
| 22.07.2022 | 607 | 648 | 548 |
| 21.07.2022 | 587 | 640 | 528 |
| 20.07.2022 | 565 | 618 | 524 |
| 19.07.2022 | 576 | 632 | 531 |
| 18.07.2022 | 516 | 598 | 439 |
© Bayerisches Landesamt für Umwelt 2024