
- Start >
- Rivers >
- Discharge >
- Untere Donau >
- Pfelling >
- Chart of year

Chart of year Pfelling / Donau
Discharge from 29.03.2024 to 28.03.2025
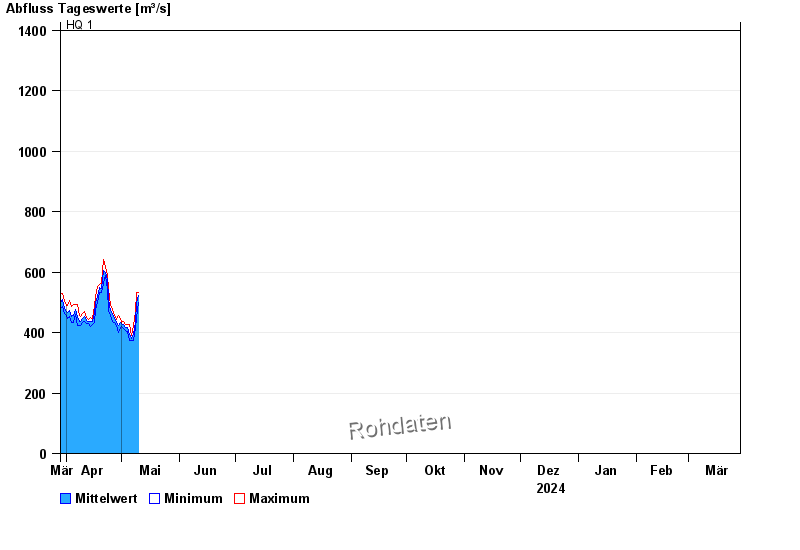
- HQ1 1400 m³/s
- HQ2 1620 m³/s
- HQ5 1900 m³/s
- HQ10 2250 m³/s
- HQ20 2600 m³/s
- HQ50 3050 m³/s
- HQ100 3400 m³/s
| Date | Mean value [m³/s] | Maximum [m³/s] | Minimum [m³/s] |
|---|---|---|---|
| 16.10.2024 | 581 | 590 | 569 |
| 15.10.2024 | 580 | 590 | 548 |
| 14.10.2024 | 529 | 563 | 502 |
| 13.10.2024 | 580 | 599 | 551 |
| 12.10.2024 | 570 | 602 | 540 |
| 11.10.2024 | 556 | 572 | 531 |
| 10.10.2024 | 576 | 602 | 540 |
© Bayerisches Landesamt für Umwelt 2024