
- Start >
- Rivers >
- Discharge >
- Untere Donau >
- Pfelling >
- Chart of year

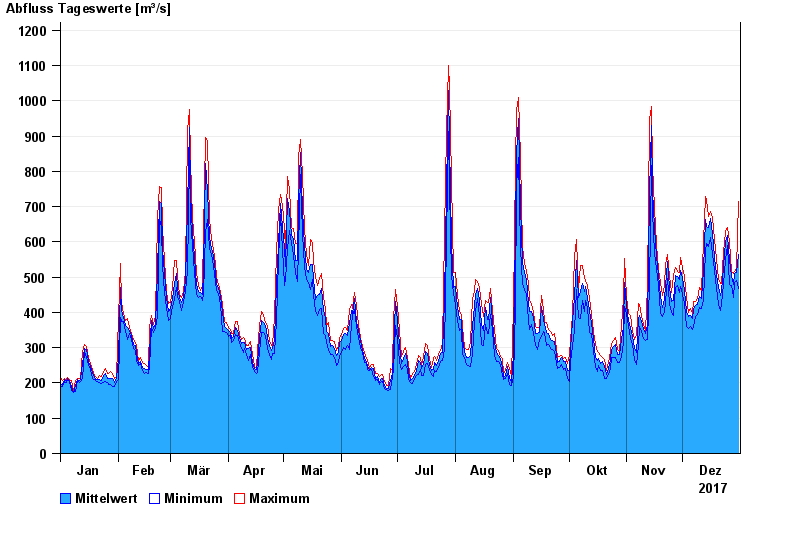
Chart of year Pfelling / Donau
Discharge from 01.01.2017 to 31.12.2017
| Date | Mean value [m³/s] | Maximum [m³/s] | Minimum [m³/s] |
|---|---|---|---|
| 31.12.2017 | 565 | 713 | 469 |
| 30.12.2017 | 513 | 524 | 491 |
| 29.12.2017 | 511 | 516 | 485 |
| 28.12.2017 | 480 | 510 | 443 |
| 27.12.2017 | 502 | 516 | 475 |
| 26.12.2017 | 547 | 601 | 480 |
| 25.12.2017 | 617 | 641 | 589 |
© Bayerisches Landesamt für Umwelt 2024