
- Start >
- Rivers >
- Discharge >
- Untere Donau >
- Plattling >
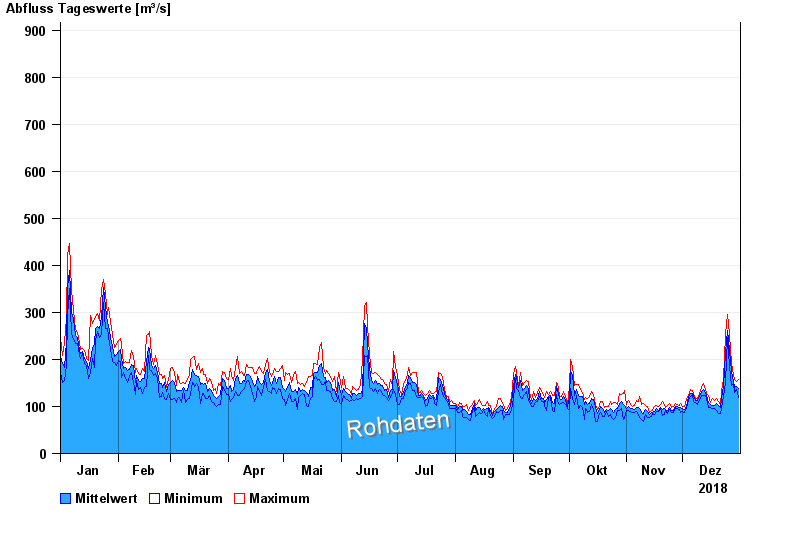
- Chart of year

Chart of year Plattling / Isar
Discharge from 01.01.2018 to 31.12.2018
- HQ100 1250 m³/s
| Date | Mean value [m³/s] | Maximum [m³/s] | Minimum [m³/s] |
|---|---|---|---|
| 31.12.2018 | 141 | 158 | 122 |
| 30.12.2018 | 146 | 153 | 138 |
| 29.12.2018 | 143 | 158 | 131 |
| 28.12.2018 | 156 | 168 | 149 |
| 27.12.2018 | 176 | 192 | 146 |
| 26.12.2018 | 220 | 252 | 189 |
| 25.12.2018 | 264 | 296 | 249 |
© Bayerisches Landesamt für Umwelt 2024