
- Start >
- Rivers >
- Discharge >
- Untere Donau >
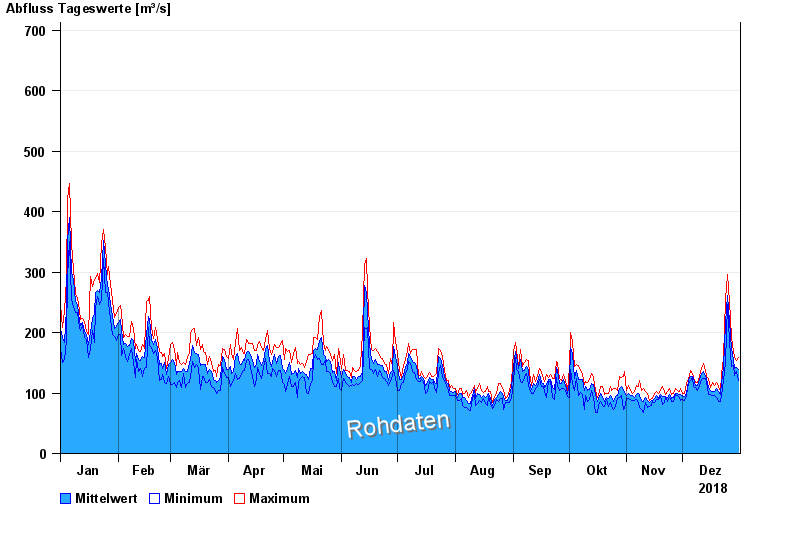
- Plattling >
- Chart of year

Chart of year Plattling / Isar
Discharge from 01.01.2018 to 31.12.2018
- 11.07.1954 Abfluss: 1360 m³/s
- 02.06.1940 Abfluss: 1260 m³/s
- 04.06.2013 Abfluss: 1110 m³/s
- 24.05.1999 Abfluss: 1020 m³/s
- 25.08.2005 Abfluss: 995 m³/s
| Date | Mean value [m³/s] | Maximum [m³/s] | Minimum [m³/s] |
|---|---|---|---|
| 31.12.2018 | 141 | 160 | 122 |
| 30.12.2018 | 146 | 155 | 138 |
| 29.12.2018 | 143 | 161 | 131 |
| 28.12.2018 | 156 | 170 | 149 |
| 27.12.2018 | 176 | 194 | 146 |
| 26.12.2018 | 220 | 255 | 189 |
| 25.12.2018 | 264 | 298 | 249 |
© Bayerisches Landesamt für Umwelt 2024