
- Start >
- Rivers >
- Discharge >
- Untere Donau >
- Ruhstorf >
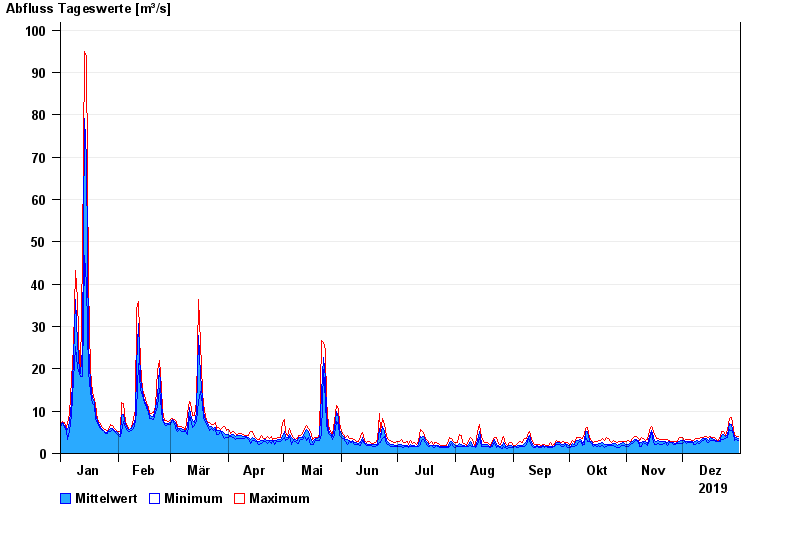
- Chart of year

Chart of year Ruhstorf / Rott
Discharge from 01.01.2019 to 31.12.2019
| Date | Mean value [m³/s] | Maximum [m³/s] | Minimum [m³/s] |
|---|---|---|---|
| 31.12.2019 | 3.55 | 3.92 | 3.12 |
| 30.12.2019 | 3.72 | 3.9 | 3.3 |
| 29.12.2019 | 3.9 | 4.53 | 3.1 |
| 28.12.2019 | 4.8 | 5.66 | 4.52 |
| 27.12.2019 | 6.74 | 8.51 | 5.42 |
| 26.12.2019 | 6.98 | 8.23 | 5.64 |
| 25.12.2019 | 4.56 | 5.64 | 3.84 |
© Bayerisches Landesamt für Umwelt 2024