
- Start >
- Rivers >
- Discharge >
- Untere Donau >
- Salching >
- Chart of year

Chart of year Salching / Aiterach
Discharge from 10.08.2020 to 09.08.2021
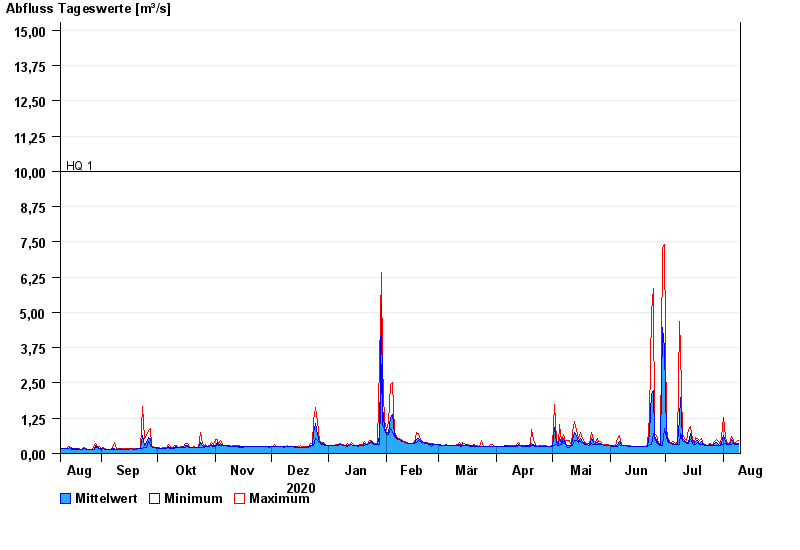
- HQ1 10 m³/s
- HQ2 16 m³/s
- HQ5 23 m³/s
- HQ10 28 m³/s
- HQ20 33 m³/s
- HQ50 40 m³/s
- HQ100 45 m³/s
| Date | Mean value [m³/s] | Maximum [m³/s] | Minimum [m³/s] |
|---|---|---|---|
| 09.08.2021 | 0.358 | 0.448 | 0.306 |
| 08.08.2021 | 0.358 | 0.418 | 0.334 |
| 07.08.2021 | 0.333 | 0.363 | 0.309 |
| 06.08.2021 | 0.384 | 0.453 | 0.363 |
| 05.08.2021 | 0.483 | 0.585 | 0.312 |
| 04.08.2021 | 0.324 | 0.367 | 0.312 |
| 03.08.2021 | 0.318 | 0.341 | 0.313 |
© Bayerisches Landesamt für Umwelt 2024