
- Start >
- Rivers >
- Discharge >
- Untere Donau >
- Schlehdorf >
- Chart of year

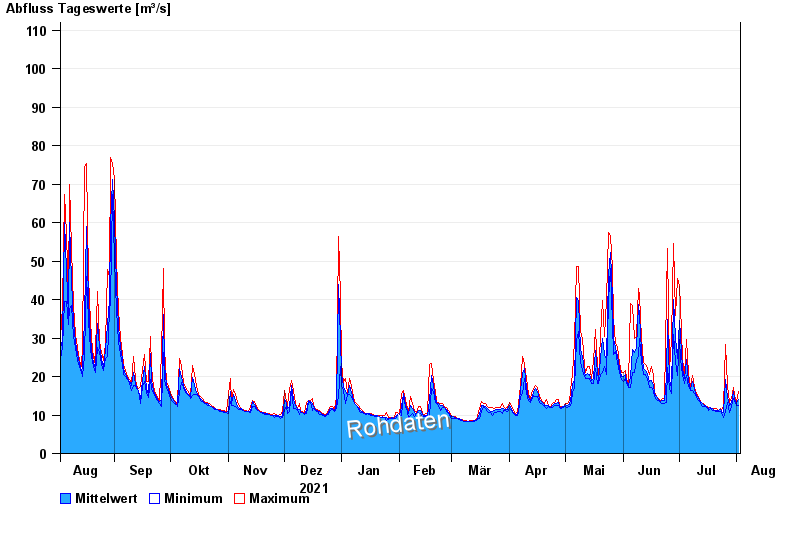
Chart of year Schlehdorf / Loisach
Discharge from 03.08.2021 to 02.08.2022
- 22.05.1999 Abfluss: 360 m³/s
- 11.08.1970 Abfluss: 343 m³/s
- 23.08.2005 Abfluss: 330 m³/s
- 08.07.1946 Abfluss: 321 m³/s
- 31.05.1940 Abfluss: 312 m³/s
| Date | Mean value [m³/s] | Maximum [m³/s] | Minimum [m³/s] |
|---|---|---|---|
| 02.08.2022 | 14.1 | 16 | 12.6 |
| 01.08.2022 | 13 | 13.6 | 12.6 |
| 31.07.2022 | 14.4 | 15.2 | 13.6 |
| 30.07.2022 | 16.1 | 17.2 | 14.4 |
| 29.07.2022 | 13.3 | 14.4 | 12.2 |
| 28.07.2022 | 12.4 | 13.3 | 10.7 |
| 27.07.2022 | 14.6 | 17.8 | 13.3 |
© Bayerisches Landesamt für Umwelt 2024