
- Start >
- Rivers >
- Discharge >
- Untere Donau >
- Staudach >
- Chart of year

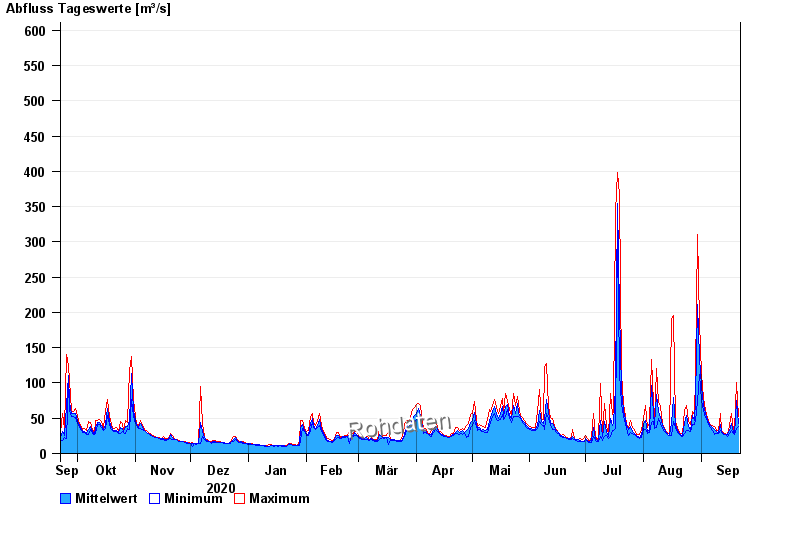
Chart of year Staudach / Tiroler Achen
Discharge from 22.09.2020 to 21.09.2021
- 02.06.2013 Abfluss: 966 m³/s
- 31.05.1940 Abfluss: 780 m³/s
- 31.07.1924 Abfluss: 687 m³/s
- 12.08.2002 Abfluss: 678 m³/s
- 14.06.1959 Abfluss: 671 m³/s
| Date | Mean value [m³/s] | Maximum [m³/s] | Minimum [m³/s] |
|---|---|---|---|
| 21.09.2021 | 43 | 52.6 | 37.8 |
| 20.09.2021 | 75.5 | 101 | 34.8 |
| 19.09.2021 | 27.6 | 33.3 | 27 |
| 18.09.2021 | 30.3 | 32.6 | 28.3 |
| 17.09.2021 | 42 | 56.2 | 32.6 |
| 16.09.2021 | 32.6 | 39.4 | 28.3 |
| 15.09.2021 | 26.5 | 27.6 | 23.7 |
© Bayerisches Landesamt für Umwelt 2024