
- Start >
- Rivers >
- Discharge >
- Untere Donau >
- Wallersdorf >
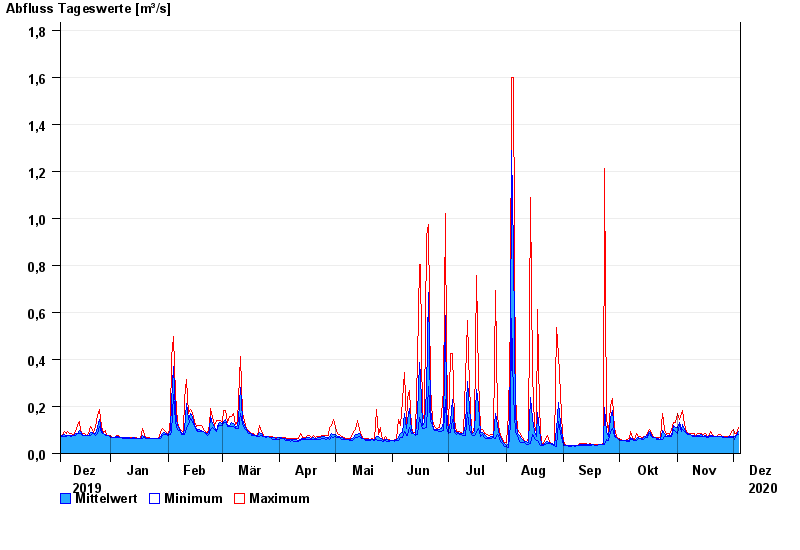
- Chart of year

Chart of year Wallersdorf / Reißingerbach
Discharge from 05.12.2019 to 04.12.2020
| Date | Mean value [m³/s] | Maximum [m³/s] | Minimum [m³/s] |
|---|---|---|---|
| 04.12.2020 | 0.092 | 0.112 | 0.079 |
| 03.12.2020 | 0.079 | 0.086 | 0.079 |
| 02.12.2020 | 0.073 | 0.086 | 0.06 |
| 01.12.2020 | 0.072 | 0.103 | 0.066 |
| 30.11.2020 | 0.072 | 0.094 | 0.066 |
| 29.11.2020 | 0.071 | 0.072 | 0.066 |
| 28.11.2020 | 0.07 | 0.072 | 0.066 |
© Bayerisches Landesamt für Umwelt 2024