
- Start >
- Rivers >
- Discharge >
- Untere Donau >
- Wallersdorf >
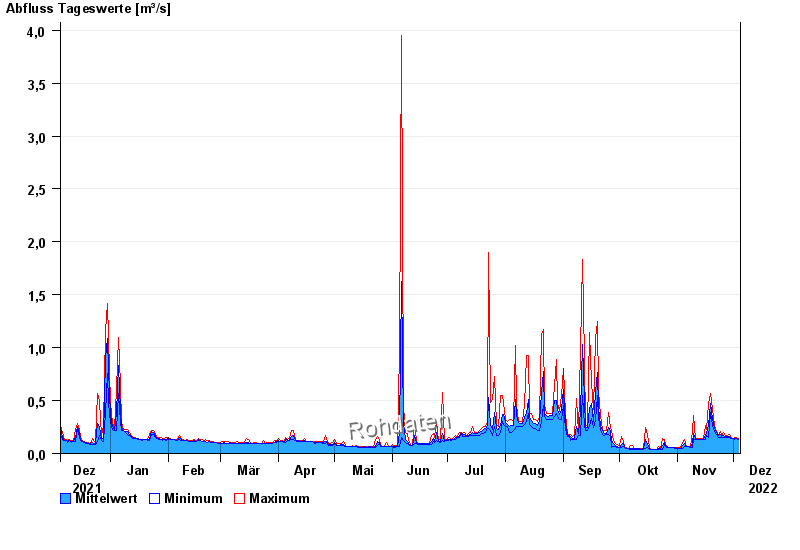
- Chart of year

Chart of year Wallersdorf / Reißingerbach
Discharge from 05.12.2021 to 04.12.2022
| Date | Mean value [m³/s] | Maximum [m³/s] | Minimum [m³/s] |
|---|---|---|---|
| 04.12.2022 | 0.137 | 0.142 | 0.131 |
| 03.12.2022 | 0.142 | 0.154 | 0.142 |
| 02.12.2022 | 0.144 | 0.154 | 0.131 |
| 01.12.2022 | 0.142 | 0.142 | 0.142 |
| 30.11.2022 | 0.146 | 0.154 | 0.142 |
| 29.11.2022 | 0.158 | 0.181 | 0.154 |
| 28.11.2022 | 0.157 | 0.167 | 0.154 |
© Bayerisches Landesamt für Umwelt 2024