

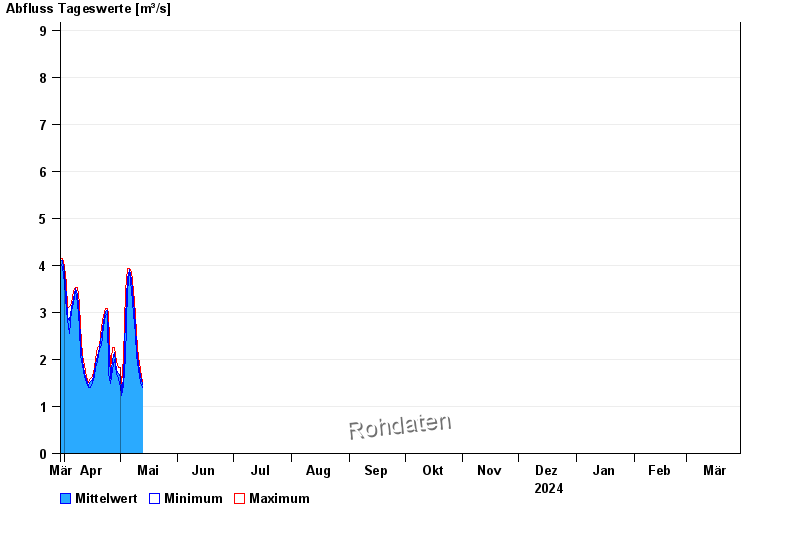
Chart of year Aha / Altmühl
Discharge from 30.03.2024 to 29.03.2025
- HQ1 41 m³/s
- HQ2 57 m³/s
- HQ5 75 m³/s
- HQ10 98 m³/s
- HQ20 120 m³/s
- HQ50 150 m³/s
- HQ100 180 m³/s
| Date | Mean value [m³/s] | Maximum [m³/s] | Minimum [m³/s] |
|---|---|---|---|
| 16.10.2024 | 12.6 | 13.5 | 12 |
| 15.10.2024 | 13.6 | 14.5 | 10.7 |
| 14.10.2024 | 7.06 | 10.7 | 6.5 |
| 13.10.2024 | 6.18 | 6.5 | 5.85 |
| 12.10.2024 | 5.74 | 5.85 | 5.7 |
| 11.10.2024 | 5.61 | 5.7 | 5.56 |
| 10.10.2024 | 5.56 | 5.56 | 5.56 |
© Bayerisches Landesamt für Umwelt 2024