

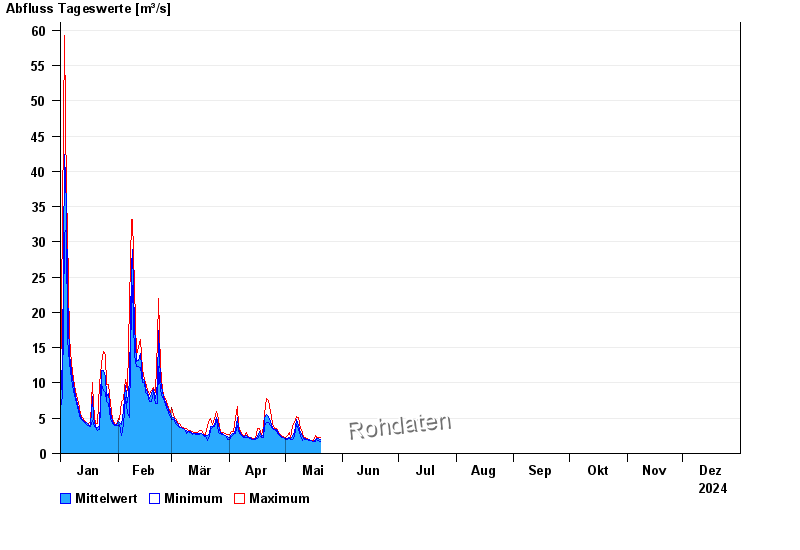
Chart of year Arzberg / Röslau
Discharge from 01.01.2024 to 31.12.2024
| Date | Mean value [m³/s] | Maximum [m³/s] | Minimum [m³/s] |
|---|---|---|---|
| 16.10.2024 | 2.8 | 2.92 | 2.66 |
| 15.10.2024 | 3.15 | 3.61 | 2.79 |
| 14.10.2024 | 3.14 | 3.76 | 1.65 |
| 13.10.2024 | 4.01 | 4.55 | 3.61 |
| 12.10.2024 | 5.94 | 9.76 | 3.91 |
| 11.10.2024 | 8.21 | 11.5 | 3.46 |
| 10.10.2024 | 2.88 | 3.61 | 1.45 |
© Bayerisches Landesamt für Umwelt 2024