
- Start >
- Rivers >
- Discharge >
- Regnitz >
- Beilngries oberh. der Sulz >
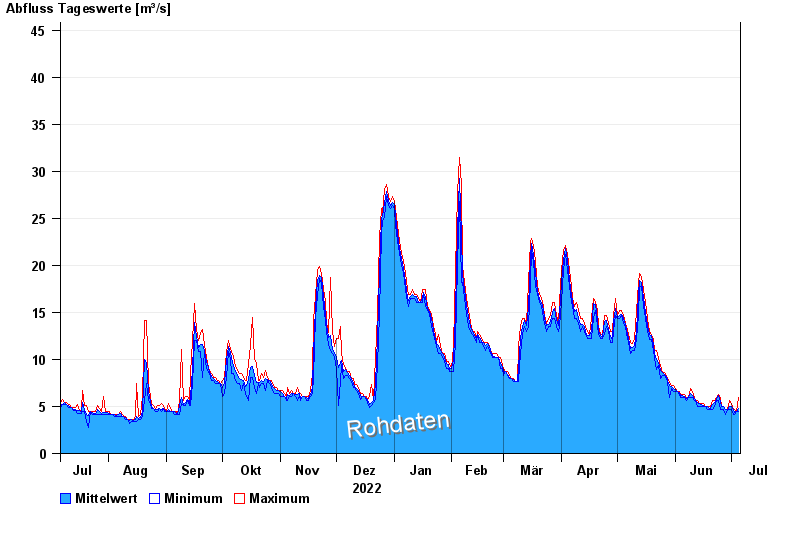
- Chart of year

Chart of year Beilngries oberh. der Sulz / Altmühl
Discharge from 06.07.2022 to 05.07.2023
- 19.03.1988 Abfluss: 198 m³/s
- 06.03.1987 Abfluss: 171 m³/s
- 15.01.2011 Abfluss: 164 m³/s
- 16.04.1994 Abfluss: 160 m³/s
- 24.12.1993 Abfluss: 158 m³/s
| Date | Mean value [m³/s] | Maximum [m³/s] | Minimum [m³/s] |
|---|---|---|---|
| 05.07.2023 | 4.74 | 5.95 | 4.45 |
| 04.07.2023 | 4.45 | 4.45 | 4.45 |
| 03.07.2023 | 4.41 | 4.73 | 4.18 |
| 02.07.2023 | 4.59 | 4.73 | 4.18 |
| 01.07.2023 | 4.95 | 5.33 | 4.73 |
| 30.06.2023 | 4.97 | 5.64 | 4.73 |
| 29.06.2023 | 4.73 | 4.73 | 4.73 |
© Bayerisches Landesamt für Umwelt 2025