
- Start >
- Rivers >
- Discharge >
- Regnitz >
- Emskirchen >
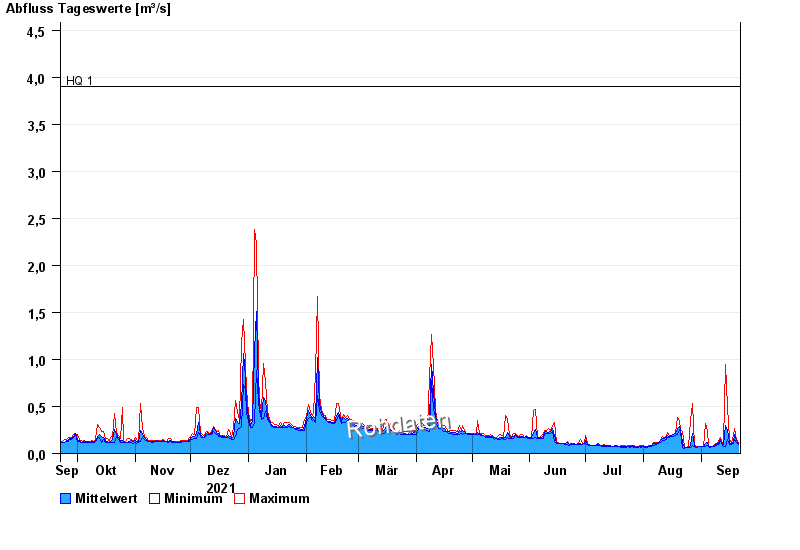
- Chart of year

Chart of year Emskirchen / Mittlere Aurach
Discharge from 22.09.2021 to 21.09.2022
note
Wasserstand und Abfluss wird zeitweise durch Biberdamm beeinflusst.
- HQ1 3,9 m³/s
- HQ2 6,6 m³/s
- HQ5 9,2 m³/s
- HQ10 13,4 m³/s
- HQ20 18,7 m³/s
- HQ50 28,9 m³/s
- HQ100 39,6 m³/s
| Date | Mean value [m³/s] | Maximum [m³/s] | Minimum [m³/s] |
|---|---|---|---|
| 21.09.2022 | 0.095 | 0.108 | 0.085 |
| 20.09.2022 | 0.12 | 0.14 | 0.103 |
| 19.09.2022 | 0.183 | 0.245 | 0.134 |
| 18.09.2022 | 0.107 | 0.185 | 0.093 |
| 17.09.2022 | 0.088 | 0.093 | 0.084 |
| 16.09.2022 | 0.103 | 0.139 | 0.089 |
| 15.09.2022 | 0.227 | 0.48 | 0.139 |
© Bayerisches Landesamt für Umwelt 2024