

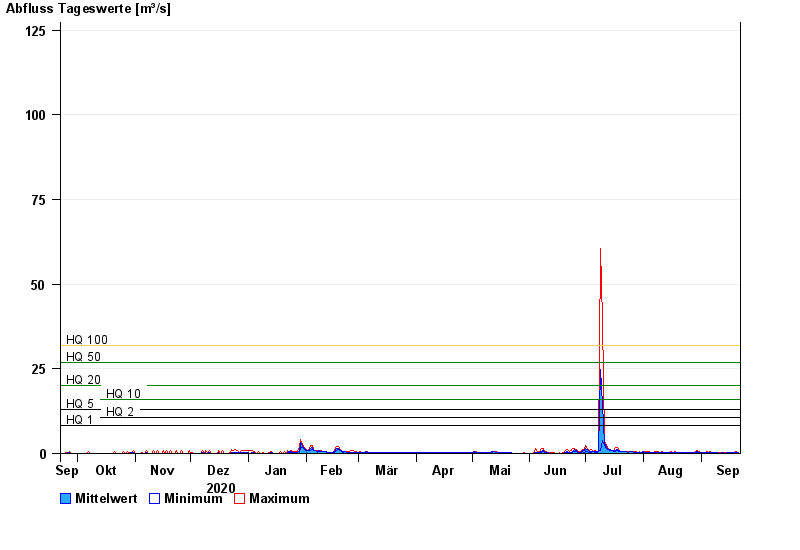
Chart of year Illesheim / Aisch
Discharge from 22.09.2020 to 21.09.2021
note
Wasserstand und Abfluss wird zeitweise durch Biberdamm beeinflusst.
- HQ1 8,2 m³/s
- HQ2 10,5 m³/s
- HQ5 13 m³/s
- HQ10 16 m³/s
- HQ20 20 m³/s
- HQ50 27 m³/s
- HQ100 32 m³/s
| Date | Mean value [m³/s] | Maximum [m³/s] | Minimum [m³/s] |
|---|---|---|---|
| 21.09.2021 | 0.162 | 0.163 | 0.161 |
| 20.09.2021 | 0.174 | 0.539 | 0.084 |
| 19.09.2021 | 0.175 | 0.196 | 0.161 |
| 18.09.2021 | 0.178 | 0.196 | 0.167 |
| 17.09.2021 | 0.191 | 0.217 | 0.181 |
| 16.09.2021 | 0.171 | 0.217 | 0.14 |
| 15.09.2021 | 0.15 | 0.201 | 0.122 |
© Bayerisches Landesamt für Umwelt 2024