
- Start >
- Rivers >
- Discharge >
- Regnitz >
- Kreppendorf >
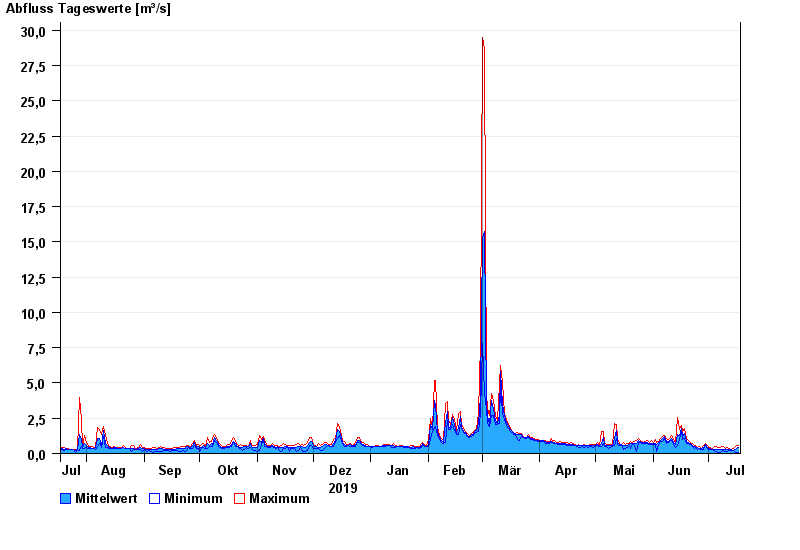
- Chart of year

Chart of year Kreppendorf / Zenn
Discharge from 18.07.2019 to 17.07.2020
| Date | Mean value [m³/s] | Maximum [m³/s] | Minimum [m³/s] |
|---|---|---|---|
| 17.07.2020 | 0.45 | 0.591 | 0.078 |
| 16.07.2020 | 0.358 | 0.535 | 0.072 |
| 15.07.2020 | 0.279 | 0.48 | 0.084 |
| 14.07.2020 | 0.246 | 0.32 | 0.235 |
| 13.07.2020 | 0.255 | 0.283 | 0.235 |
| 12.07.2020 | 0.259 | 0.36 | 0.235 |
| 11.07.2020 | 0.305 | 0.454 | 0.13 |
© Bayerisches Landesamt für Umwelt 2024