
- Start >
- Rivers >
- Discharge >
- Regnitz >
- Laubendorf >
- Chart of year

Chart of year Laubendorf / Zenn
Discharge from 18.09.2020 to 17.09.2021
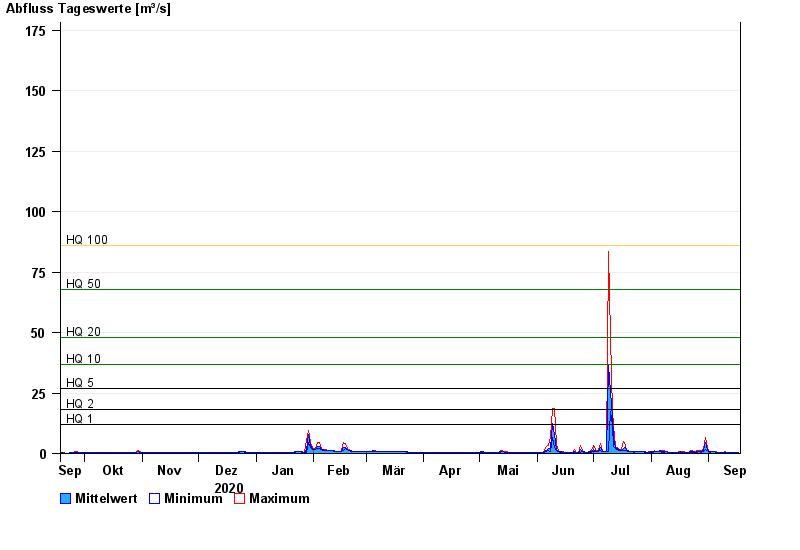
- HQ1 12 m³/s
- HQ2 18 m³/s
- HQ5 27 m³/s
- HQ10 37 m³/s
- HQ20 48 m³/s
- HQ50 68 m³/s
- HQ100 86 m³/s
| Date | Mean value [m³/s] | Maximum [m³/s] | Minimum [m³/s] |
|---|---|---|---|
| 17.09.2021 | 0.524 | 0.525 | 0.524 |
| 16.09.2021 | 0.508 | 0.526 | 0.486 |
| 15.09.2021 | 0.475 | 0.488 | 0.448 |
| 14.09.2021 | 0.472 | 0.529 | 0.449 |
| 13.09.2021 | 0.49 | 0.491 | 0.489 |
| 12.09.2021 | 0.492 | 0.492 | 0.491 |
| 11.09.2021 | 0.486 | 0.513 | 0.436 |
© Bayerisches Landesamt für Umwelt 2024