
- Start >
- Rivers >
- Discharge >
- Regnitz >
- Laubendorf >
- Chart of year

Chart of year Laubendorf / Zenn
Discharge from 22.01.2021 to 21.01.2022
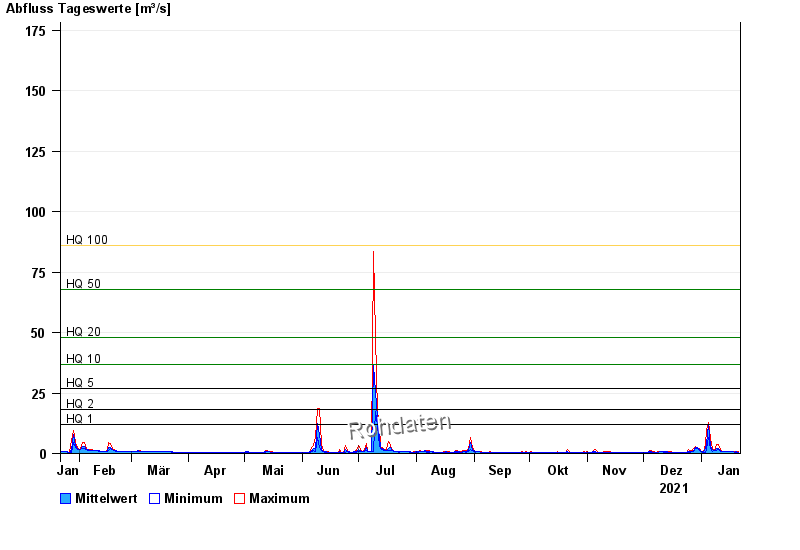
- HQ1 12 m³/s
- HQ2 18 m³/s
- HQ5 27 m³/s
- HQ10 37 m³/s
- HQ20 48 m³/s
- HQ50 68 m³/s
- HQ100 86 m³/s
| Date | Mean value [m³/s] | Maximum [m³/s] | Minimum [m³/s] |
|---|---|---|---|
| 21.01.2022 | 0.589 | 0.703 | 0.44 |
| 20.01.2022 | 0.634 | 0.703 | 0.478 |
| 19.01.2022 | 0.61 | 0.653 | 0.561 |
| 18.01.2022 | 0.655 | 0.678 | 0.629 |
| 17.01.2022 | 0.632 | 0.653 | 0.629 |
| 16.01.2022 | 0.661 | 0.678 | 0.653 |
| 15.01.2022 | 0.687 | 0.703 | 0.678 |
© Bayerisches Landesamt für Umwelt 2024