
- Start >
- Rivers >
- Discharge >
- Regnitz >
- Laubendorf >
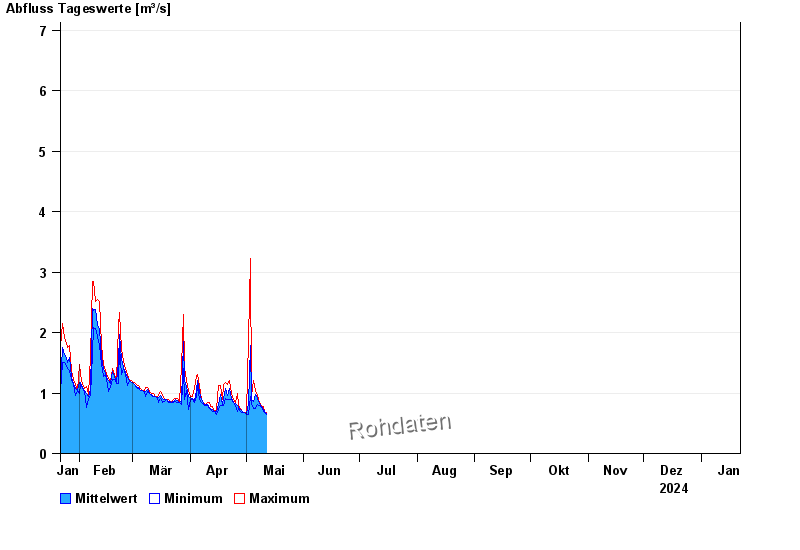
- Chart of year

Chart of year Laubendorf / Zenn
Discharge from 22.01.2024 to 21.01.2025
- HQ1 12 m³/s
- HQ2 18 m³/s
- HQ5 27 m³/s
- HQ10 37 m³/s
- HQ20 48 m³/s
- HQ50 68 m³/s
- HQ100 86 m³/s
| Date | Mean value [m³/s] | Maximum [m³/s] | Minimum [m³/s] |
|---|---|---|---|
| 12.07.2024 | 0.537 | 0.553 | 0.531 |
| 11.07.2024 | 0.597 | 0.643 | 0.553 |
| 10.07.2024 | 0.576 | 0.666 | 0.509 |
| 09.07.2024 | 0.535 | 0.553 | 0.531 |
| 08.07.2024 | 0.564 | 0.597 | 0.553 |
| 07.07.2024 | 0.598 | 0.62 | 0.597 |
| 06.07.2024 | 0.602 | 0.62 | 0.597 |
© Bayerisches Landesamt für Umwelt 2024