
- Start >
- Rivers >
- Discharge >
- Regnitz >
- Laubendorf >
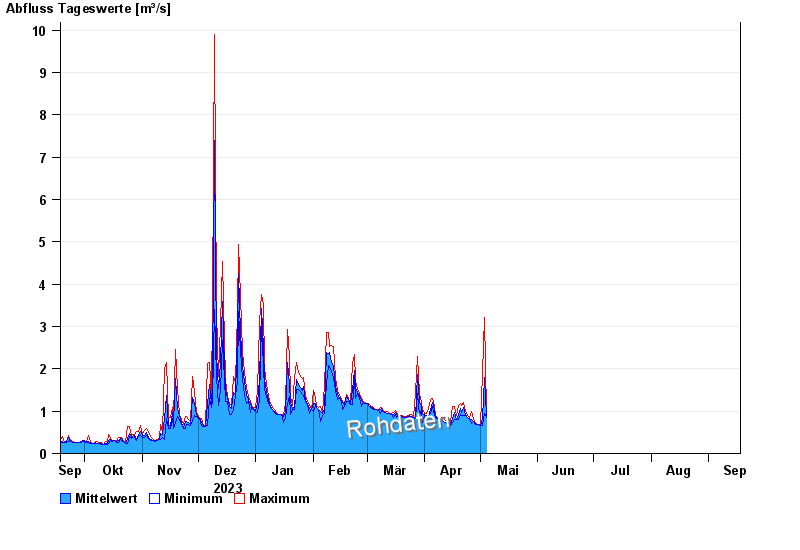
- Chart of year

Chart of year Laubendorf / Zenn
Discharge from 18.09.2023 to 17.09.2024
| Date | Mean value [m³/s] | Maximum [m³/s] | Minimum [m³/s] |
|---|---|---|---|
| 12.08.2024 | 0.312 | 0.312 | 0.312 |
| 11.08.2024 | 0.312 | 0.312 | 0.312 |
| 10.08.2024 | 0.329 | 0.403 | 0.249 |
| 09.08.2024 | 0.35 | 0.384 | 0.346 |
| 08.08.2024 | 0.36 | 0.384 | 0.346 |
| 07.08.2024 | 0.382 | 0.384 | 0.364 |
| 06.08.2024 | 0.403 | 0.423 | 0.384 |
© Bayerisches Landesamt für Umwelt 2024