
- Start >
- Rivers >
- Discharge >
- Regnitz >
- Laubendorf >
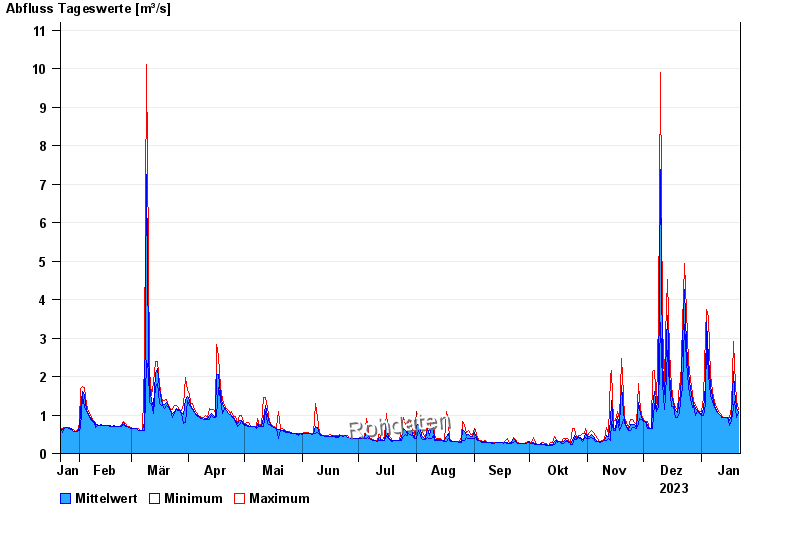
- Chart of year

Chart of year Laubendorf / Zenn
Discharge from 22.01.2023 to 21.01.2024
| Date | Mean value [m³/s] | Maximum [m³/s] | Minimum [m³/s] |
|---|---|---|---|
| 21.01.2024 | 1.06 | 1.14 | 1.03 |
| 20.01.2024 | 1.2 | 1.35 | 0.928 |
| 19.01.2024 | 1.62 | 2.3 | 1.35 |
| 18.01.2024 | 2.14 | 2.92 | 1.19 |
| 17.01.2024 | 0.959 | 1.19 | 0.853 |
| 16.01.2024 | 0.863 | 0.928 | 0.732 |
| 15.01.2024 | 0.928 | 0.928 | 0.928 |
© Bayerisches Landesamt für Umwelt 2024