
- Start >
- Rivers >
- Discharge >
- Regnitz >
- Michelfeld >
- Chart of year

Chart of year Michelfeld / Pegnitz
Discharge from 01.01.2023 to 31.12.2023
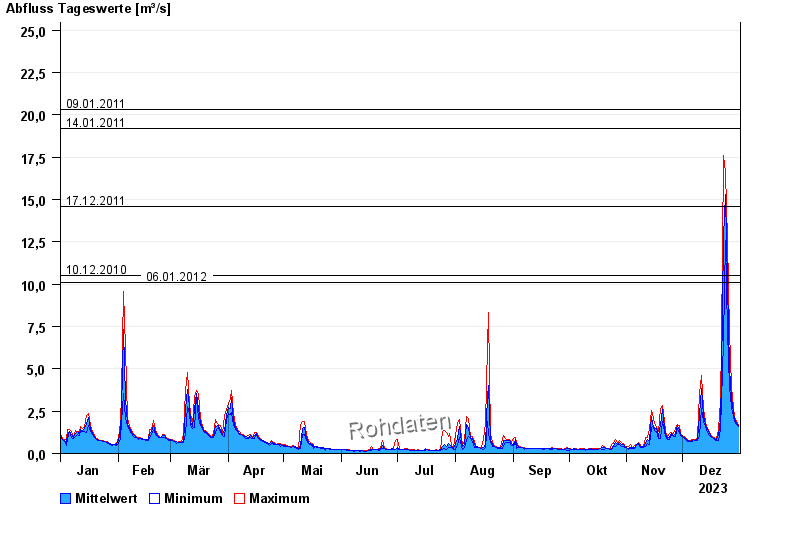
- 09.01.2011 Abfluss: 17,9 m³/s
- 14.01.2011 Abfluss: 16,8 m³/s
- 03.01.2003 Abfluss: 15,9 m³/s
- 13.02.2005 Abfluss: 15,1 m³/s
- 09.06.2002 Abfluss: 15,1 m³/s
| Date | Mean value [m³/s] | Maximum [m³/s] | Minimum [m³/s] |
|---|---|---|---|
| 31.12.2023 | 1.65 | 1.73 | 1.58 |
| 30.12.2023 | 1.78 | 1.88 | 1.73 |
| 29.12.2023 | 2.01 | 2.16 | 1.88 |
| 28.12.2023 | 2.41 | 2.73 | 2.2 |
| 27.12.2023 | 3.23 | 3.89 | 2.73 |
| 26.12.2023 | 5 | 7.23 | 3.89 |
| 25.12.2023 | 10 | 12.6 | 7.23 |
© Bayerisches Landesamt für Umwelt 2024