

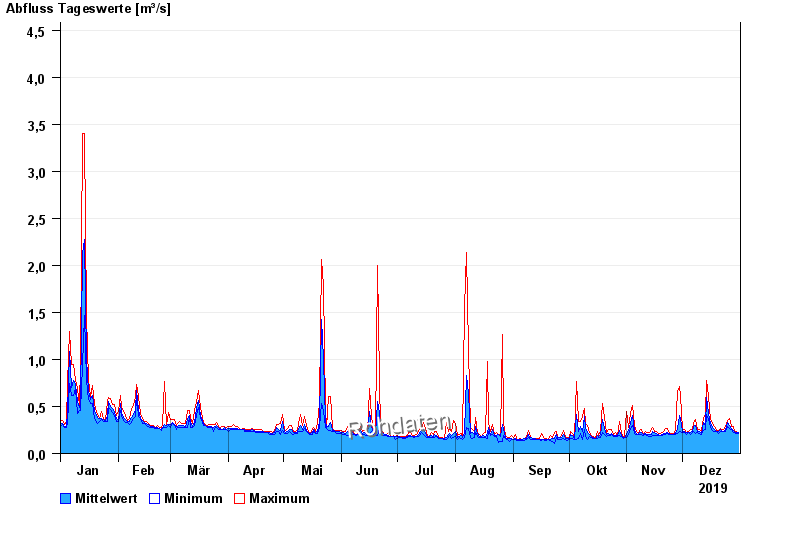
Chart of year Schwabach / Schwabach
Discharge from 01.01.2019 to 31.12.2019
- 08.01.2011 Abfluss: 8,17 m³/s
- 09.03.2006 Abfluss: 8,11 m³/s
- 02.03.1987 Abfluss: 7,37 m³/s
- 29.10.1998 Abfluss: 7,36 m³/s
- 16.03.2005 Abfluss: 7,26 m³/s
| Date | Mean value [m³/s] | Maximum [m³/s] | Minimum [m³/s] |
|---|---|---|---|
| 31.12.2019 | 0.224 | 0.225 | 0.21 |
| 30.12.2019 | 0.224 | 0.239 | 0.21 |
| 29.12.2019 | 0.224 | 0.238 | 0.223 |
| 28.12.2019 | 0.243 | 0.29 | 0.223 |
| 27.12.2019 | 0.268 | 0.29 | 0.253 |
| 26.12.2019 | 0.3 | 0.374 | 0.27 |
| 25.12.2019 | 0.326 | 0.351 | 0.287 |
© Bayerisches Landesamt für Umwelt 2024