

Chart of year Staudach / Tiroler Achen
Discharge from 11.05.2021 to 10.05.2022
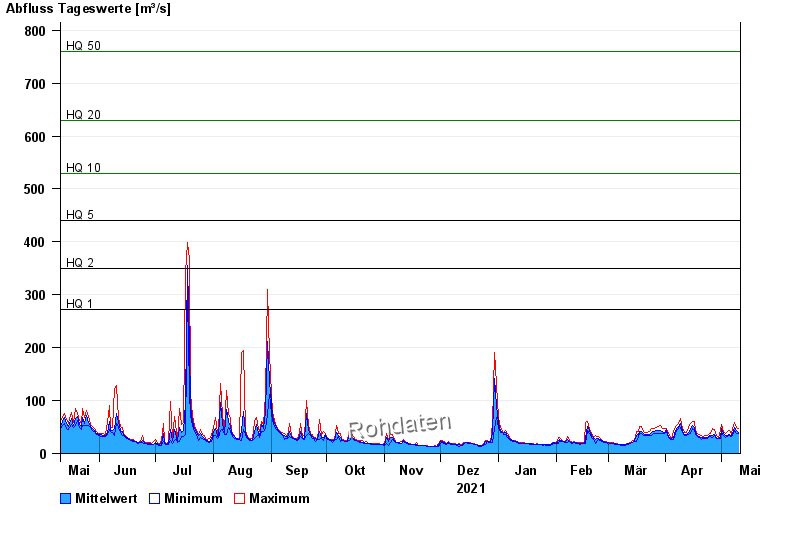
- HQ1 272 m³/s
- HQ2 350 m³/s
- HQ5 440 m³/s
- HQ10 530 m³/s
- HQ20 630 m³/s
- HQ50 760 m³/s
- HQ100 870 m³/s
| Date | Mean value [m³/s] | Maximum [m³/s] | Minimum [m³/s] |
|---|---|---|---|
| 10.05.2022 | 40.5 | 48.1 | 36.9 |
| 09.05.2022 | 43.5 | 49.8 | 38.4 |
| 08.05.2022 | 50 | 58.5 | 43.9 |
| 07.05.2022 | 42.9 | 53.2 | 37.6 |
| 06.05.2022 | 34.2 | 36.9 | 32.4 |
| 05.05.2022 | 36.8 | 43.9 | 33.8 |
| 04.05.2022 | 34.5 | 41.5 | 31.7 |
© Bayerisches Landesamt für Umwelt 2025