
- Start >
- Rivers >
- Suspended sediment >
- Bayern >
- Inkofen >
- Chart of year

Chart of year Inkofen / Amper
Suspended sediment from 01.01.2017 to 31.12.2017
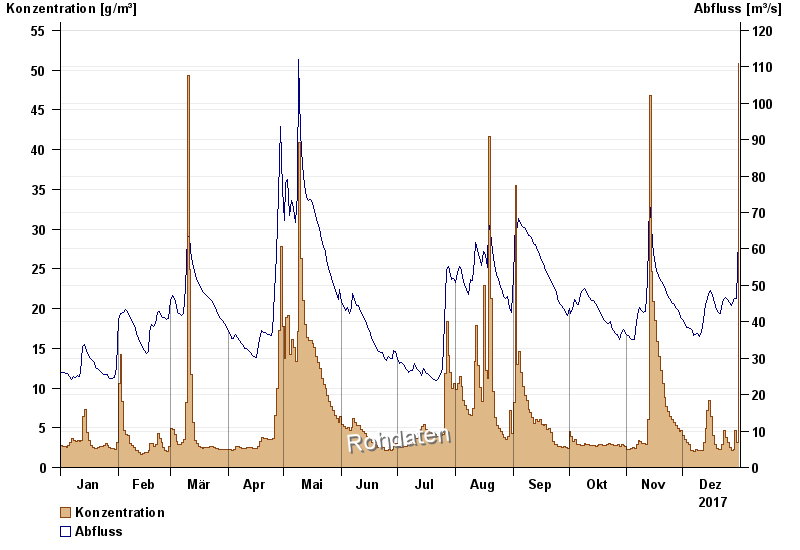
| Date | concentration [g/m³] | Runoff [m³/s] |
|---|---|---|
| 31.12.2017 | 50.8 | 63.5 |
| 30.12.2017 | 3.1 | 46.3 |
| 29.12.2017 | 4.6 | 46.5 |
| 28.12.2017 | 2.3 | 45.9 |
| 27.12.2017 | 2.2 | 44.4 |
| 26.12.2017 | 2.5 | 45.2 |
| 25.12.2017 | 3.2 | 46.0 |
© Bayerisches Landesamt für Umwelt 2025