
- Start >
- Rivers >
- Suspended sediment >
- Bayern >
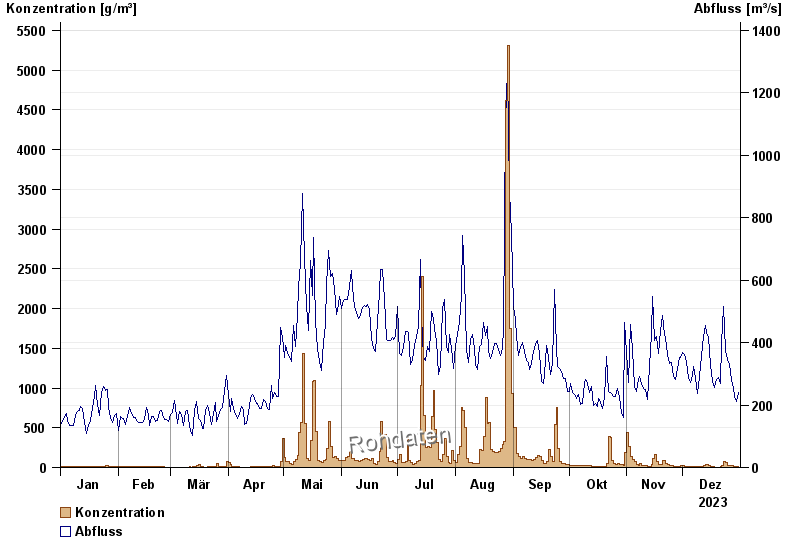
- Rosenheim o.d. Mangfallmündung >
- Chart of year

Chart of year Rosenheim o.d. Mangfallmündung / Inn
Suspended sediment from 01.01.2023 to 31.12.2023
| Date | concentration [g/m³] | Runoff [m³/s] |
|---|---|---|
| 31.12.2023 | 6.9 | 242.0 |
| 30.12.2023 | 9.7 | 212.0 |
| 29.12.2023 | 9.9 | 223.0 |
| 28.12.2023 | 16.5 | 254.0 |
| 27.12.2023 | 24.4 | 278.0 |
| 26.12.2023 | 19.8 | 327.0 |
| 25.12.2023 | 27.7 | 345.0 |
© Bayerisches Landesamt für Umwelt 2025