
- Start >
- Rivers >
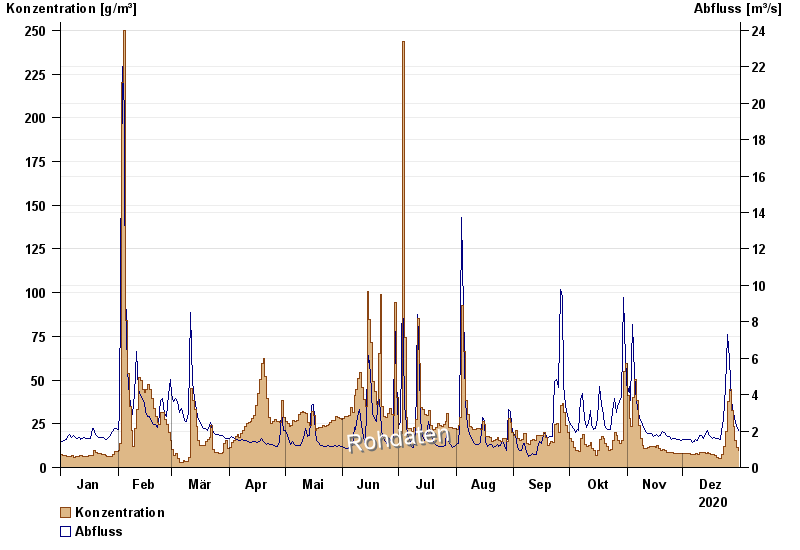
- Suspended sediment >
- Unterer Main >
- Linden >
- Chart of year

Chart of year Linden / Rott
Suspended sediment from 01.01.2020 to 31.12.2020
| Date | concentration [g/m³] | Runoff [m³/s] |
|---|---|---|
| 31.12.2020 | 9.6 | 2.0 |
| 30.12.2020 | 11.6 | 2.3 |
| 29.12.2020 | 15.4 | 2.7 |
| 28.12.2020 | 23.3 | 3.0 |
| 27.12.2020 | 32.8 | 3.6 |
| 26.12.2020 | 44.7 | 5.9 |
| 25.12.2020 | 37.7 | 7.3 |
© Bayerisches Landesamt für Umwelt 2024