
- Start >
- Rivers >
- Suspended sediment >
- Untere Donau >
- Plattling >
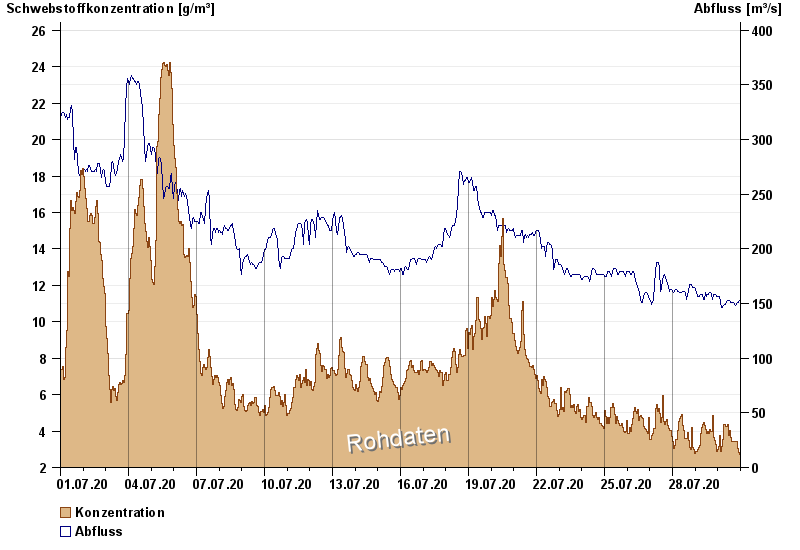
- Chart of month

Chart of month Plattling / Isar
Suspended sediment from 01.07.2020 to 30.07.2020
| Date | concentration [g/m³] | Runoff [m³/s] |
|---|---|---|
| 30.07.2020 23:45 | 2.2 | 150.0 |
| 30.07.2020 23:30 | 2.4 | 150.0 |
| 30.07.2020 23:15 | 2.3 | 150.0 |
| 30.07.2020 23:00 | 2.3 | 150.0 |
| 30.07.2020 22:45 | 2.4 | 149.0 |
| 30.07.2020 22:30 | 2.5 | 149.0 |
| 30.07.2020 22:15 | 2.5 | 149.0 |
© Bayerisches Landesamt für Umwelt 2024