
- Start >
- Rivers >
- Waterlevel >
- Bayern >
- Bärenthal >
- Chart of year

Chart of year Bärenthal / Trubach
Waterlevel from 01.01.2020 to 31.12.2020
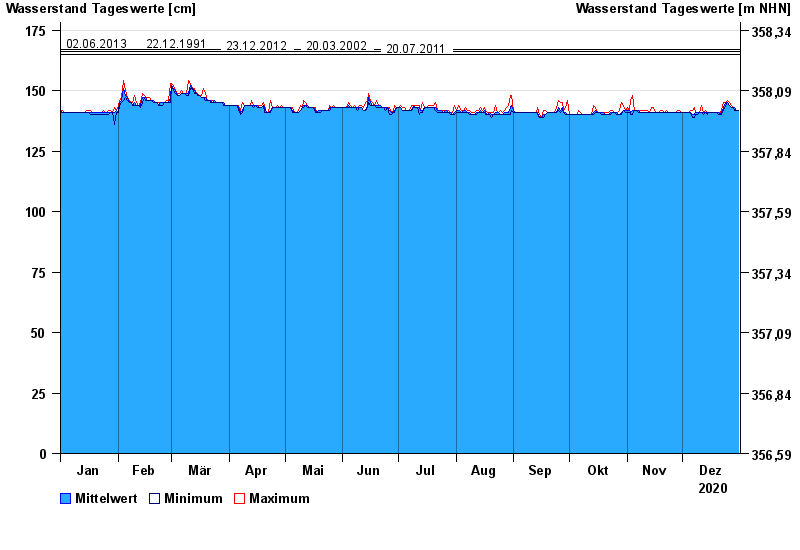
- 20.04.1983 Wasserstand: 168 cm
- 02.06.2013 Wasserstand: 167 cm
- 22.12.1991 Wasserstand: 167 cm
- 17.08.2023 Wasserstand: 166 cm
- 23.12.2012 Wasserstand: 166 cm
| Date | Mean value [cm] | Maximum [cm] | Minimum [cm] |
|---|---|---|---|
| 31.12.2020 | 142 | 142 | 142 |
| 30.12.2020 | 142 | 142 | 142 |
| 29.12.2020 | 143 | 143 | 142 |
| 28.12.2020 | 143 | 143 | 143 |
| 27.12.2020 | 143 | 144 | 143 |
| 26.12.2020 | 144 | 145 | 144 |
| 25.12.2020 | 145 | 146 | 145 |
© Bayerisches Landesamt für Umwelt 2025