
- Start >
- Rivers >
- Waterlevel >
- Bayern >
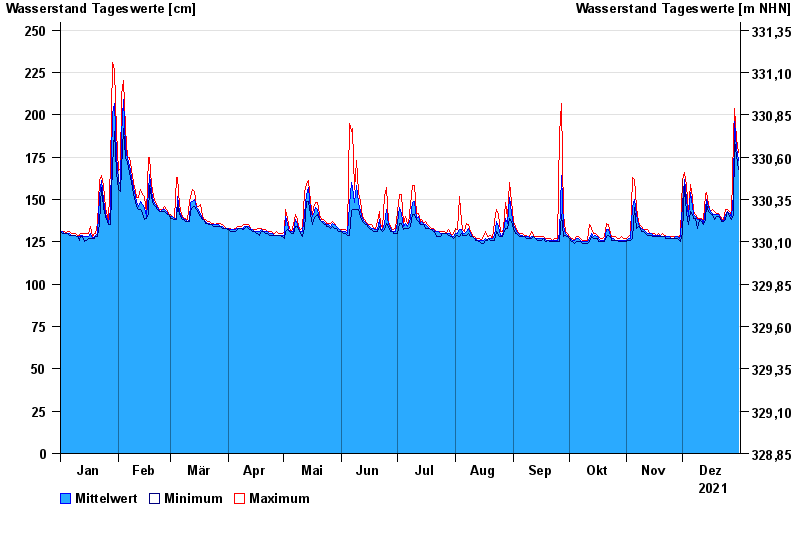
- Bayreuth >
- Chart of year

Chart of year Bayreuth / Roter Main
Waterlevel from 01.01.2021 to 31.12.2021
- 26.01.1995 Wasserstand: 295 cm
- 06.06.1984 Wasserstand: 288 cm
- 15.06.1987 Wasserstand: 276 cm
- 21.12.1993 Wasserstand: 274 cm
- 13.01.2011 Wasserstand: 273 cm
| Date | Mean value [cm] | Maximum [cm] | Minimum [cm] |
|---|---|---|---|
| 31.12.2021 | 173 | 178 | 168 |
| 30.12.2021 | 180 | 186 | 176 |
| 29.12.2021 | 196 | 204 | 185 |
| 28.12.2021 | 153 | 186 | 141 |
| 27.12.2021 | 140 | 141 | 138 |
| 26.12.2021 | 142 | 143 | 140 |
| 25.12.2021 | 143 | 144 | 143 |
© Bayerisches Landesamt für Umwelt 2025