
- Start >
- Rivers >
- Waterlevel >
- Bayern >
- Beuerberg >
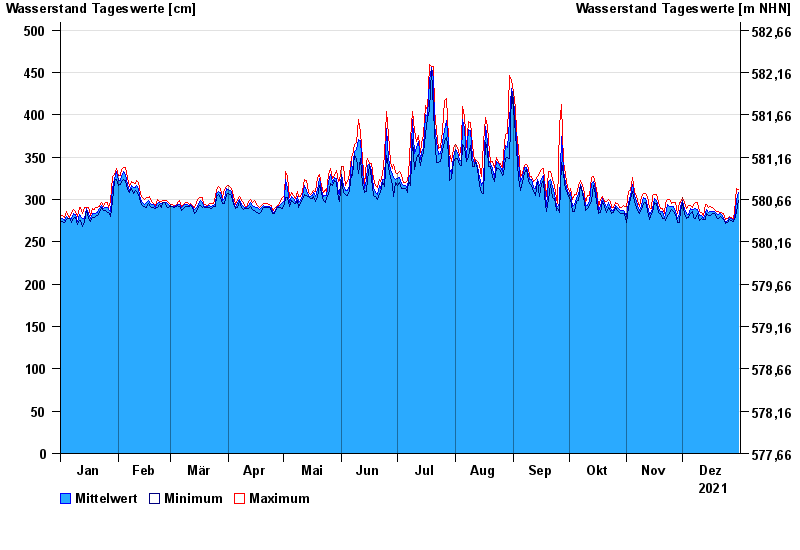
- Chart of year

Chart of year Beuerberg / Loisach
Waterlevel from 01.01.2021 to 31.12.2021
- 24.05.1999 Wasserstand: 572 cm
- 23.08.2005 Wasserstand: 564 cm
- 03.06.2013 Wasserstand: 556 cm
- 18.06.1979 Wasserstand: 556 cm
- 04.08.2020 Wasserstand: 532 cm
| Date | Mean value [cm] | Maximum [cm] | Minimum [cm] |
|---|---|---|---|
| 31.12.2021 | 308 | 312 | 299 |
| 30.12.2021 | 299 | 313 | 285 |
| 29.12.2021 | 278 | 285 | 276 |
| 28.12.2021 | 275 | 277 | 274 |
| 27.12.2021 | 277 | 279 | 275 |
| 26.12.2021 | 279 | 280 | 276 |
| 25.12.2021 | 275 | 277 | 273 |
© Bayerisches Landesamt für Umwelt 2025