
- Start >
- Rivers >
- Waterlevel >
- Bayern >
- Beuerberg >
- Chart of year

Chart of year Beuerberg / Loisach
Waterlevel from 01.01.2022 to 31.12.2022
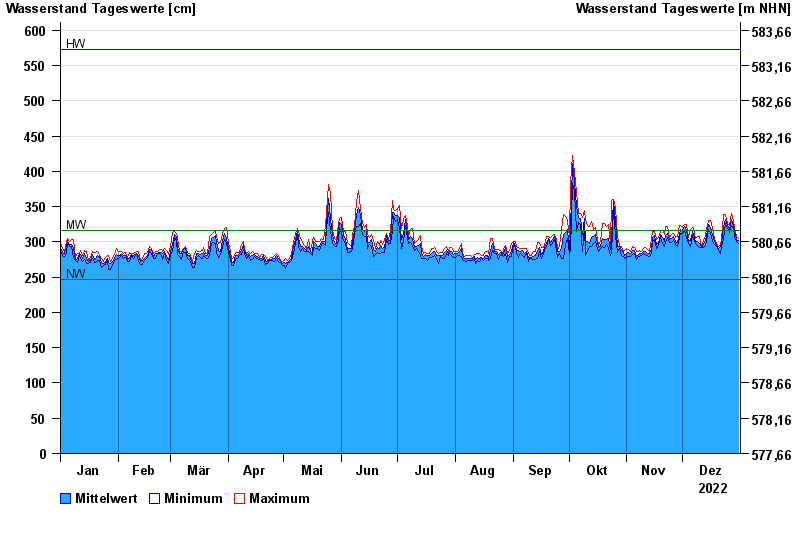
| Date | Mean value [cm] | Maximum [cm] | Minimum [cm] |
|---|---|---|---|
| 31.12.2022 | 302 | 305 | 298 |
| 30.12.2022 | 303 | 308 | 301 |
| 29.12.2022 | 315 | 321 | 308 |
| 28.12.2022 | 323 | 330 | 319 |
| 27.12.2022 | 331 | 340 | 323 |
| 26.12.2022 | 318 | 323 | 313 |
| 25.12.2022 | 323 | 326 | 319 |
© Bayerisches Landesamt für Umwelt 2025