
- Start >
- Rivers >
- Waterlevel >
- Bayern >
- Beuerberg >
- Chart of year

Chart of year Beuerberg / Loisach
Waterlevel from 01.01.2023 to 31.12.2023
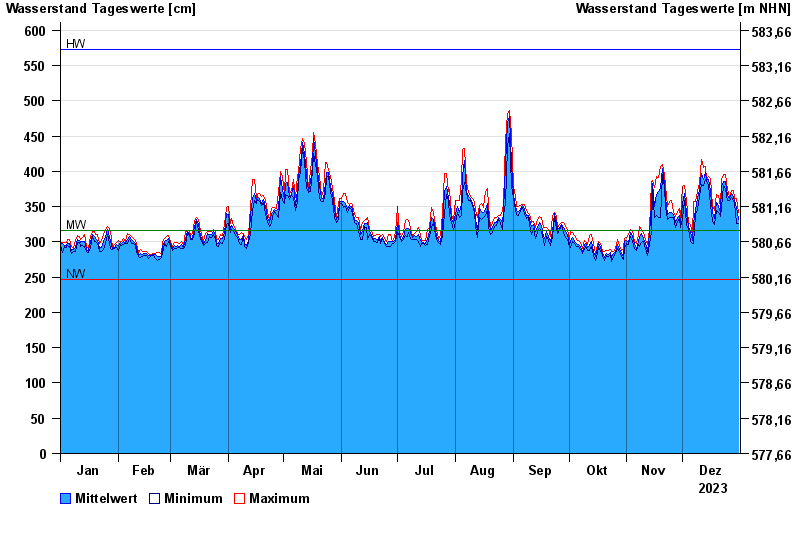
| Date | Mean value [cm] | Maximum [cm] | Minimum [cm] |
|---|---|---|---|
| 31.12.2023 | 331 | 341 | 326 |
| 30.12.2023 | 348 | 362 | 326 |
| 29.12.2023 | 358 | 361 | 355 |
| 28.12.2023 | 363 | 373 | 358 |
| 27.12.2023 | 368 | 373 | 363 |
| 26.12.2023 | 362 | 364 | 359 |
| 25.12.2023 | 365 | 374 | 359 |
© Bayerisches Landesamt für Umwelt 2025