
- Start >
- Rivers >
- Waterlevel >
- Bayern >
- Beuerberg >
- Chart of year

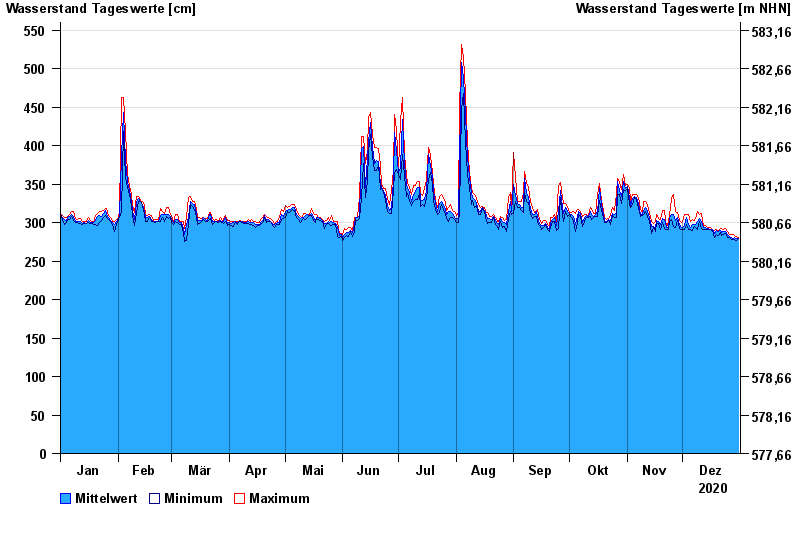
Chart of year Beuerberg / Loisach
Waterlevel from 01.01.2020 to 31.12.2020
| Date | Mean value [cm] | Maximum [cm] | Minimum [cm] |
|---|---|---|---|
| 31.12.2020 | 280 | 281 | 279 |
| 30.12.2020 | 279 | 282 | 277 |
| 29.12.2020 | 281 | 283 | 278 |
| 28.12.2020 | 280 | 284 | 278 |
| 27.12.2020 | 281 | 285 | 278 |
| 26.12.2020 | 282 | 285 | 281 |
| 25.12.2020 | 285 | 289 | 281 |
© Bayerisches Landesamt für Umwelt 2025