
- Start >
- Rivers >
- Waterlevel >
- Bayern >
- Bruckhäuser >
- Chart of year

Chart of year Bruckhäuser / Kollbach
Waterlevel from 01.01.2020 to 31.12.2020
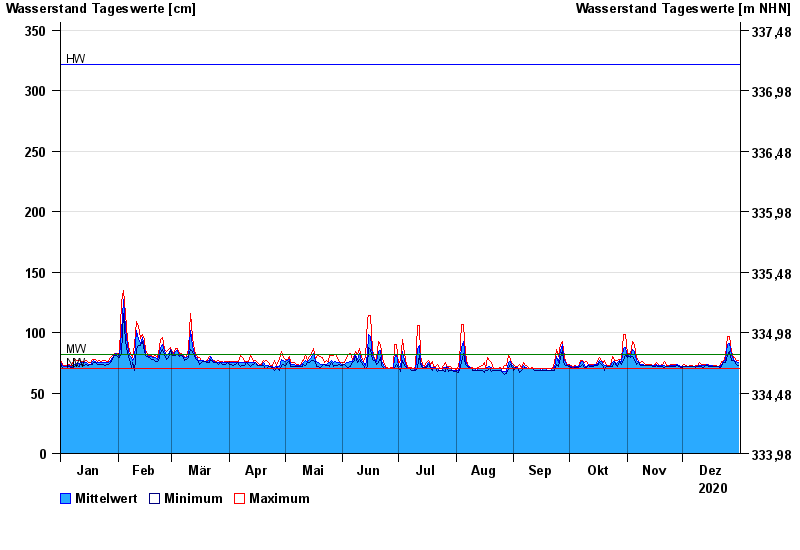
| Date | Mean value [cm] | Maximum [cm] | Minimum [cm] |
|---|---|---|---|
| 31.12.2020 | 75 | 77 | 73 |
| 30.12.2020 | 76 | 77 | 74 |
| 29.12.2020 | 77 | 79 | 76 |
| 28.12.2020 | 78 | 79 | 77 |
| 27.12.2020 | 81 | 84 | 77 |
| 26.12.2020 | 91 | 97 | 84 |
| 25.12.2020 | 90 | 97 | 81 |
© Bayerisches Landesamt für Umwelt 2025