
- Start >
- Rivers >
- Waterlevel >
- Bayern >
- Büg >
- Chart of year

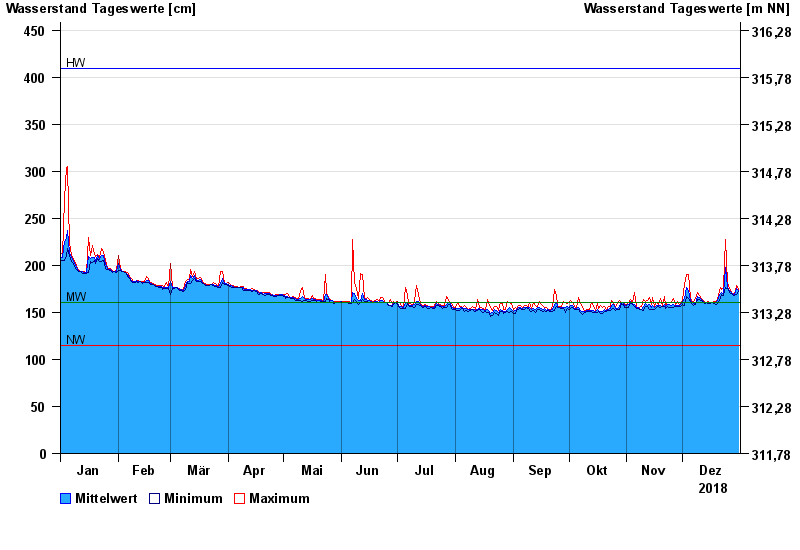
Chart of year Büg / Schwabach
Waterlevel from 01.01.2018 to 31.12.2018
| Date | Mean value [cm] | Maximum [cm] | Minimum [cm] |
|---|---|---|---|
| 31.12.2018 | 173 | 174 | 172 |
| 30.12.2018 | 175 | 179 | 169 |
| 29.12.2018 | 169 | 169 | 168 |
| 28.12.2018 | 169 | 170 | 168 |
| 27.12.2018 | 171 | 171 | 170 |
| 26.12.2018 | 173 | 175 | 171 |
| 25.12.2018 | 177 | 182 | 175 |
© Bayerisches Landesamt für Umwelt 2025