
- Start >
- Rivers >
- Waterlevel >
- Bayern >
- Bürgstadt >
- Chart of year

Chart of year Bürgstadt / Erf
Waterlevel from 22.11.2019 to 21.11.2020
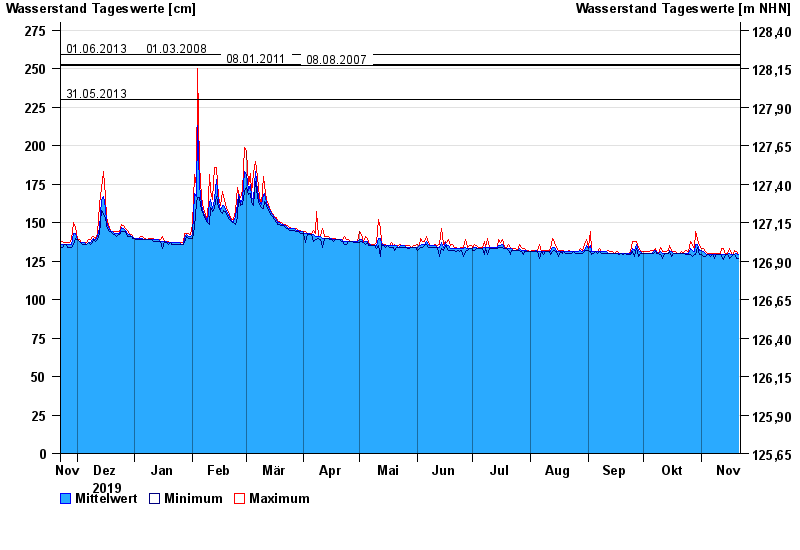
- 30.05.2016 Wasserstand: 262 cm
- 01.06.2013 Wasserstand: 259 cm
- 01.03.2008 Wasserstand: 259 cm
- 08.01.2011 Wasserstand: 253 cm
- 08.08.2007 Wasserstand: 252 cm
| Date | Mean value [cm] | Maximum [cm] | Minimum [cm] |
|---|---|---|---|
| 21.11.2020 | 129 | 129 | 127 |
| 20.11.2020 | 130 | 131 | 127 |
| 19.11.2020 | 129 | 132 | 129 |
| 18.11.2020 | 129 | 129 | 129 |
| 17.11.2020 | 129 | 130 | 128 |
| 16.11.2020 | 130 | 133 | 127 |
| 15.11.2020 | 129 | 130 | 129 |
© Bayerisches Landesamt für Umwelt 2025