
- Start >
- Rivers >
- Waterlevel >
- Bayern >
- Eching >
- Chart of month

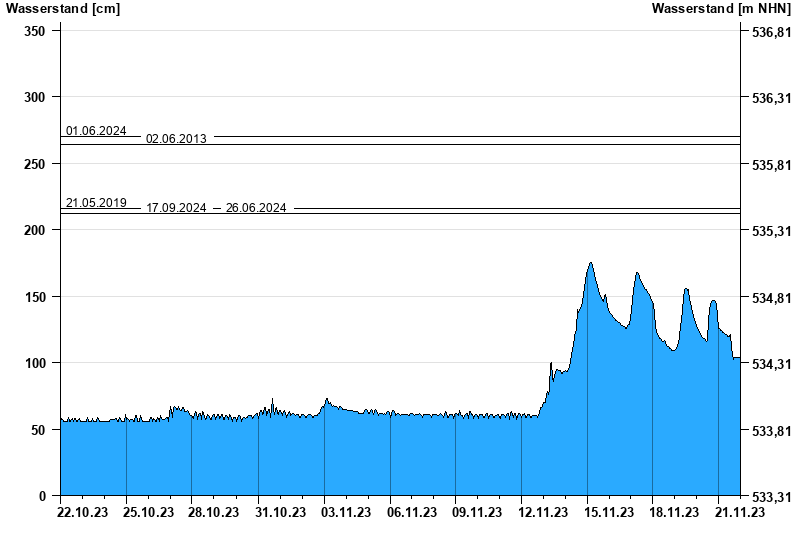
Chart of month Eching / Windach
Waterlevel from 22.10.2023 to 21.11.2023
note
Pegel beeinflusst durch Kraftwerkssteuerung
- 02.06.2013 Wasserstand: 264 cm
- 22.05.2019 Wasserstand: 216 cm
- 04.01.2015 Wasserstand: 207 cm
- 20.07.2011 Wasserstand: 200 cm
- 06.01.2013 Wasserstand: 196 cm
| Date | Waterlevel [cm] |
|---|---|
| 21.11.2023 23:45 | 103 |
| 21.11.2023 23:30 | 103 |
| 21.11.2023 23:15 | 103 |
| 21.11.2023 23:00 | 103 |
| 21.11.2023 22:45 | 104 |
| 21.11.2023 22:30 | 103 |
| 21.11.2023 22:15 | 103 |
© Bayerisches Landesamt für Umwelt 2025