
- Start >
- Rivers >
- Waterlevel >
- Bayern >
- Eßlingen >
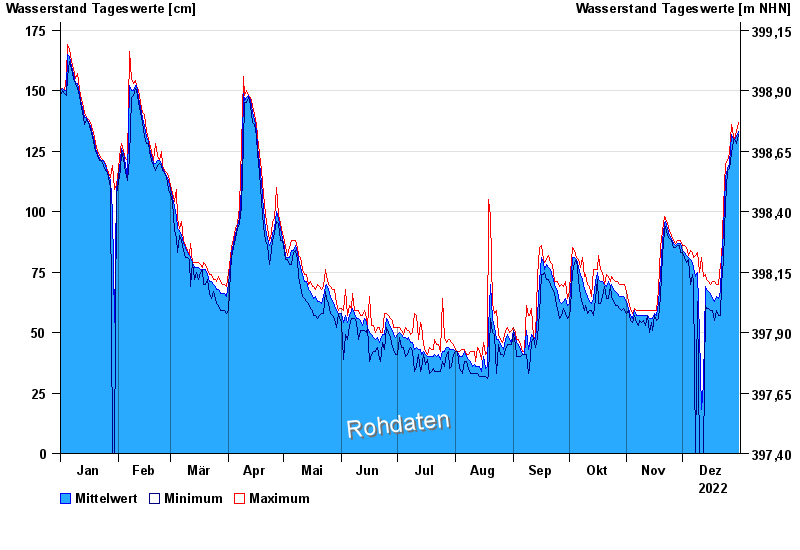
- Chart of year

Chart of year Eßlingen / Altmühl
Waterlevel from 01.01.2022 to 31.12.2022
- 14.01.2019 Wasserstand: 226 cm
- 13.03.2020 Wasserstand: 193 cm
- 24.12.2018 Wasserstand: 192 cm
- 04.02.2021 Wasserstand: 188 cm
- 05.01.2022 Wasserstand: 169 cm
| Date | Mean value [cm] | Maximum [cm] | Minimum [cm] |
|---|---|---|---|
| 31.12.2022 | 133 | 137 | 132 |
| 30.12.2022 | 131 | 133 | 128 |
| 29.12.2022 | 130 | 130 | 130 |
| 28.12.2022 | 130 | 131 | 129 |
| 27.12.2022 | 132 | 136 | 124 |
| 26.12.2022 | 120 | 124 | 118 |
| 25.12.2022 | 118 | 121 | 117 |
© Bayerisches Landesamt für Umwelt 2025