
- Start >
- Rivers >
- Waterlevel >
- Bayern >
- Faulbach >
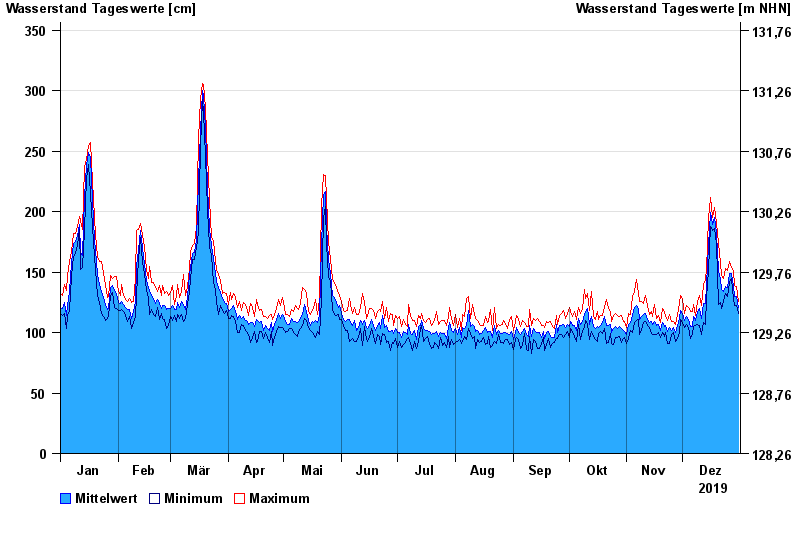
- Chart of year

Chart of year Faulbach / Main
Waterlevel from 01.01.2019 to 31.12.2019
- 26.02.1970 Wasserstand: 681 cm
- 30.01.1995 Wasserstand: 666 cm
- 04.01.2003 Wasserstand: 653 cm
- 29.03.1988 Wasserstand: 647 cm
- 17.01.2011 Wasserstand: 646 cm
| Date | Mean value [cm] | Maximum [cm] | Minimum [cm] |
|---|---|---|---|
| 31.12.2019 | 121 | 126 | 116 |
| 30.12.2019 | 130 | 138 | 122 |
| 29.12.2019 | 130 | 139 | 122 |
| 28.12.2019 | 138 | 151 | 127 |
| 27.12.2019 | 149 | 154 | 145 |
| 26.12.2019 | 149 | 159 | 141 |
| 25.12.2019 | 137 | 151 | 130 |
© Bayerisches Landesamt für Umwelt 2025