
- Start >
- Rivers >
- Waterlevel >
- Bayern >
- Füssen >
- Chart of year

Chart of year Füssen / Lech
Waterlevel from 30.01.2024 to 29.01.2025
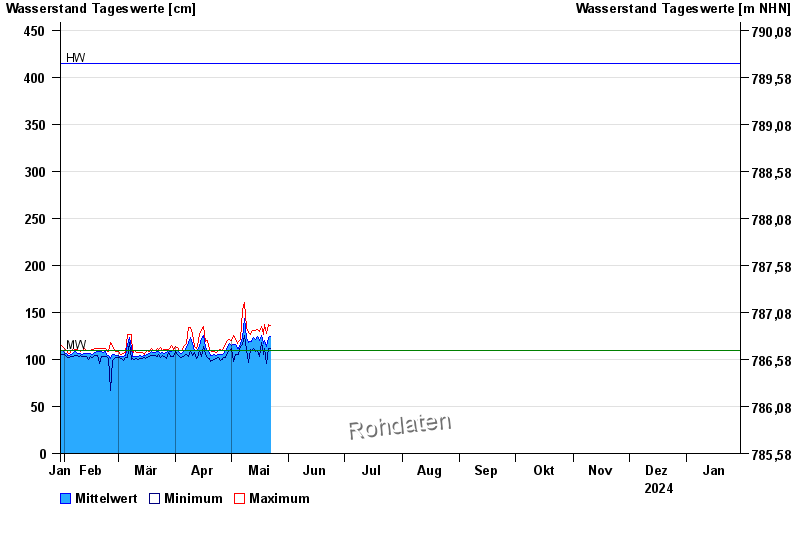
| Date | Mean value [cm] | Maximum [cm] | Minimum [cm] |
|---|---|---|---|
| 08.08.2024 | 108 | 112 | 105 |
| 07.08.2024 | 109 | 120 | 101 |
| 06.08.2024 | 109 | 112 | 103 |
| 05.08.2024 | 110 | 117 | 100 |
| 04.08.2024 | 112 | 115 | 109 |
| 03.08.2024 | 117 | 135 | 108 |
| 02.08.2024 | 118 | 129 | 105 |
© Bayerisches Landesamt für Umwelt 2024