
- Start >
- Rivers >
- Waterlevel >
- Bayern >
- Gollmuthhausen >
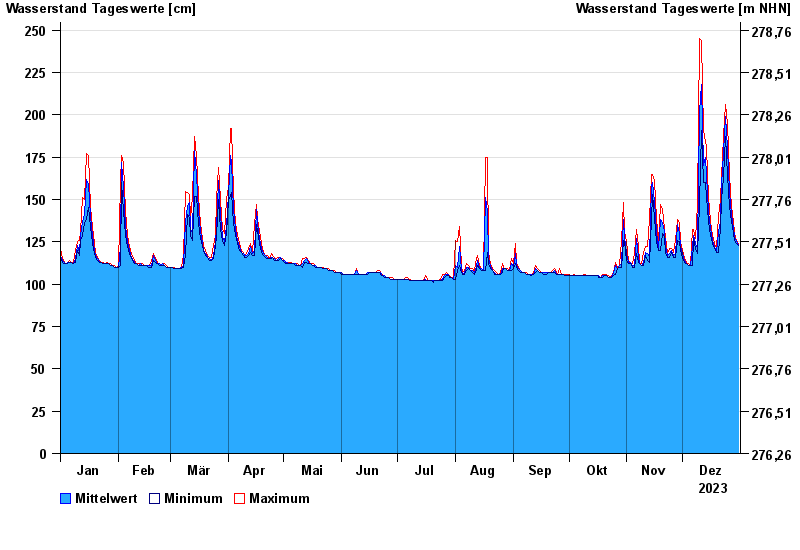
- Chart of year

Chart of year Gollmuthhausen / Milz
Waterlevel from 01.01.2023 to 31.12.2023
- 03.01.2003 Wasserstand: 311 cm
- 14.01.2011 Wasserstand: 297 cm
- 23.01.1995 Wasserstand: 286 cm
- 08.01.2011 Wasserstand: 284 cm
- 08.05.2004 Wasserstand: 281 cm
| Date | Mean value [cm] | Maximum [cm] | Minimum [cm] |
|---|---|---|---|
| 31.12.2023 | 123 | 124 | 123 |
| 30.12.2023 | 125 | 126 | 124 |
| 29.12.2023 | 128 | 130 | 126 |
| 28.12.2023 | 133 | 137 | 130 |
| 27.12.2023 | 141 | 146 | 137 |
| 26.12.2023 | 154 | 164 | 146 |
| 25.12.2023 | 180 | 195 | 164 |
© Bayerisches Landesamt für Umwelt 2025