
- Start >
- Rivers >
- Waterlevel >
- Bayern >
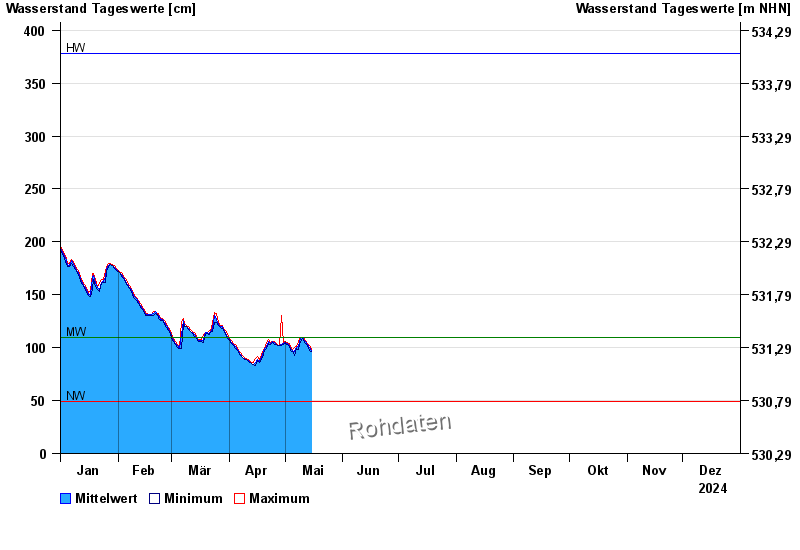
- Grafrath >
- Chart of year

Chart of year Grafrath / Amper
Waterlevel from 01.01.2024 to 31.12.2024
| Date | Mean value [cm] | Maximum [cm] | Minimum [cm] |
|---|---|---|---|
| 31.12.2024 | 88 | 90 | 87 |
| 30.12.2024 | 91 | 94 | 89 |
| 29.12.2024 | 94 | 96 | 92 |
| 28.12.2024 | 95 | 97 | 94 |
| 27.12.2024 | 97 | 98 | 94 |
| 26.12.2024 | 99 | 103 | 97 |
| 25.12.2024 | 104 | 106 | 102 |
© Bayerisches Landesamt für Umwelt 2025