
- Start >
- Rivers >
- Waterlevel >
- Bayern >
- Hafenlohr >
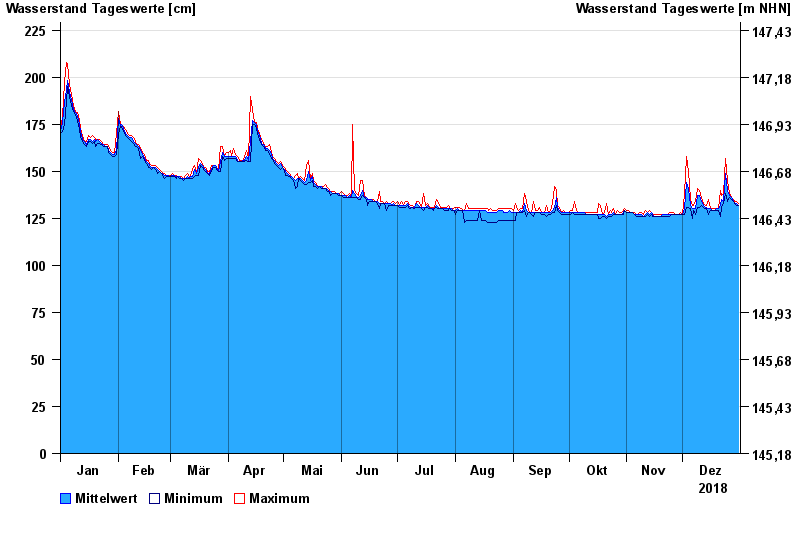
- Chart of year

Chart of year Hafenlohr / Hafenlohr
Waterlevel from 01.01.2018 to 31.12.2018
- 26.01.1995 Wasserstand: 320 cm
- 14.01.2011 Wasserstand: 312 cm
- 03.01.2003 Wasserstand: 304 cm
- 21.12.1993 Wasserstand: 298 cm
- 28.10.1998 Wasserstand: 296 cm
| Date | Mean value [cm] | Maximum [cm] | Minimum [cm] |
|---|---|---|---|
| 31.12.2018 | 132 | 133 | 132 |
| 30.12.2018 | 133 | 134 | 132 |
| 29.12.2018 | 133 | 134 | 133 |
| 28.12.2018 | 134 | 135 | 134 |
| 27.12.2018 | 136 | 136 | 135 |
| 26.12.2018 | 137 | 138 | 136 |
| 25.12.2018 | 140 | 145 | 134 |
© Bayerisches Landesamt für Umwelt 2025