
- Start >
- Rivers >
- Waterlevel >
- Bayern >
- Heinersdorf >
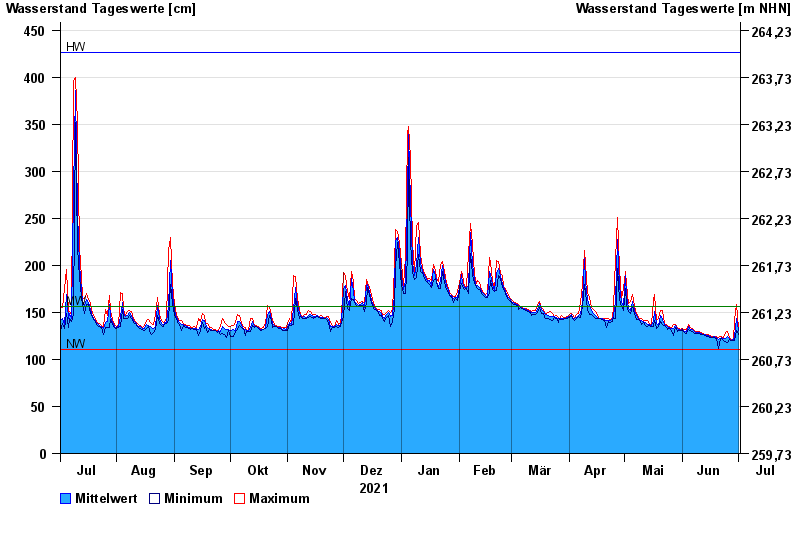
- Chart of year

Chart of year Heinersdorf / Rodach
Waterlevel from 02.07.2021 to 01.07.2022
| Date | Mean value [cm] | Maximum [cm] | Minimum [cm] |
|---|---|---|---|
| 01.07.2022 | 131 | 134 | 127 |
| 30.06.2022 | 143 | 158 | 131 |
| 29.06.2022 | 124 | 141 | 120 |
| 28.06.2022 | 121 | 121 | 120 |
| 27.06.2022 | 120 | 121 | 120 |
| 26.06.2022 | 122 | 123 | 121 |
| 25.06.2022 | 124 | 130 | 118 |
© Bayerisches Landesamt für Umwelt 2024